How to Do M&V Before Spending Money on Retrofits
As budgeting season comes to a close, real estate companies are in the process of reviewing proposals for upgrades to save on operational expenses or improve tenant comfort. Unfortunately for many of these companies, evaluating retrofit proposals depends heavily on experience and intuition instead of hard data. Even with surveys, inspections, and spot measurements, there is a lot guesswork involved in calculating the payback period of an upgrade.
Determining the effectiveness of a retrofit – measurement & verification (M&V) – is the process of quantifying the cost savings resulting from upgrades. Generally, building operators or third parties do this by periodically verifying that the installed equipment has been properly maintained, continues to operate correctly, and continues to have the potential to generate the predicted savings.
In the early days, M&V commonly consisted of comparing baseline and post-installation expenses for the entire building. While methods have developed over time to focus more closely on the equipment that was replaced or upgraded, it is still largely a retroactive strategy.
But what if this process could be performed before the installation?
Now, thanks to equipment-level performance tracking and building commissioning software, management can determine the effectiveness of retrofits during the proposal phase instead of years after. Better informed decisions can improve both the short-term profitability of a property and its long-term value.
Most decisions in building operations are not black or white. Utilizing data not only enables owners and operators to make decisions on whether to sign a contract, it allows them to work collaboratively with vendors to ensure the optimal scope of an installation.
Optimizing the Largest Loads
Not all upgrades require completely replacing equipment. Sometimes, the most impactful retrofit is installing a variable frequency drive (VFD) on an existing system. A VFD varies the speed of a motor by adjusting the frequency of the motor’s input power. Varying the speed of the motor improves efficiency by allowing the motors’ output to match actual pressure/flow requirements. Motor speed reductions lead to a cubic reduction power consumption, so a motor operating at half speed draws one eighth of the power. In addition to reducing power consumption, a VFD can also help reduce mechanical wear and maintenance needs.
While VFD technology can significantly increase system efficiency by controlling pump speed, installing a VFD is not always the most cost-effective strategy. To determine if a VFD is a wise investment, owners and operators have a variety of inputs to calculate cost savings.
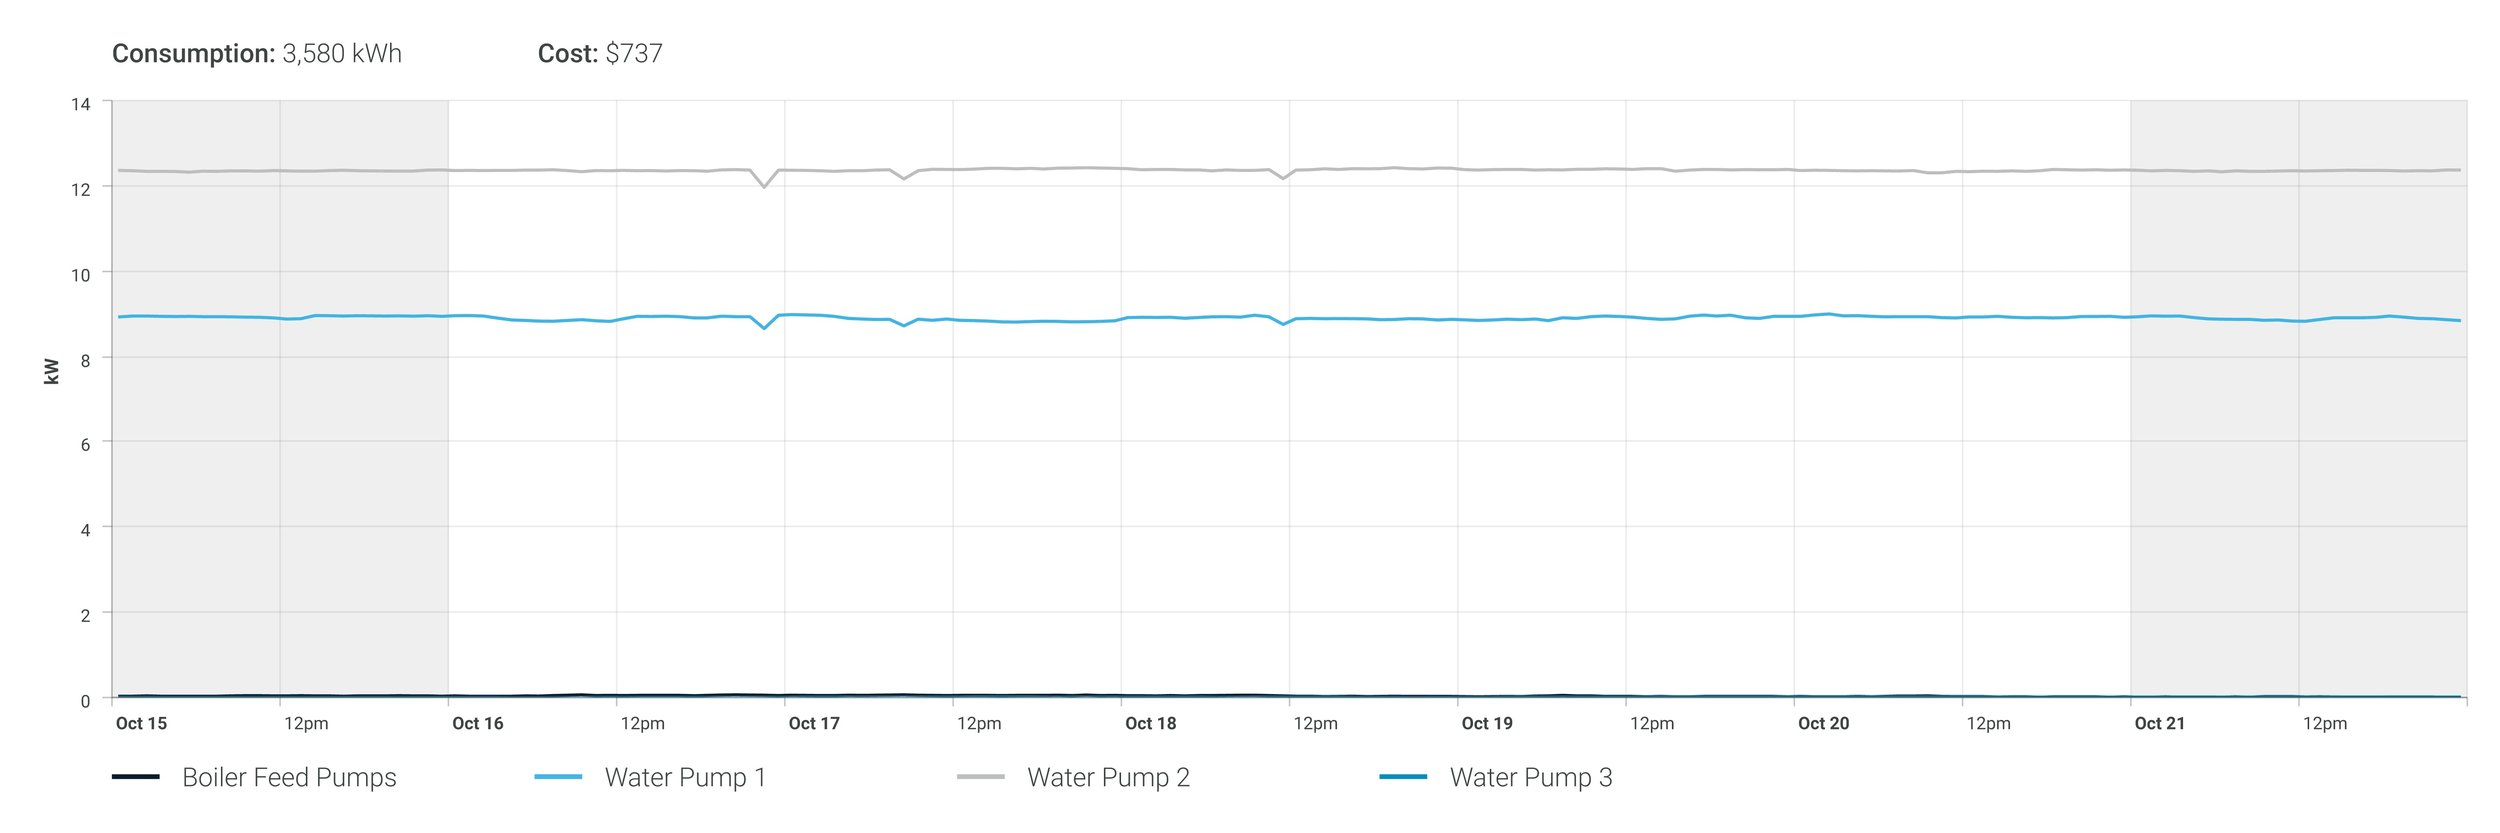
The first input is the system curve. In an existing system, the system curve is calculated using data from pressure and flow measurements, control valve position, and pump motor electric current measurements. These numbers can be compared to the manufacturer's pump curve to determine the configurations for the potential VFD.
The issue comes when estimating the time that a pump runs at low, medium and high flow rates, and kilowatt-hours (kWh) at each flow rate.
Without precise historic data on these numbers, any cost-benefit analysis will be an estimation. After gathering the horse power, voltage, rpm, and gallons per minute (GPM), operators will still need to make assumptions about annual run time and the energy costs associated with the pump motor.
These are not necessarily figures that building operators know off the top of their head and there is often no place to go for this type of information. For properties with a building management system (BMS), some data may exist in the system, but it is not easy to extract. In addition, most energy management systems (EMS) have the cost per kWh for the building and maybe a few large loads, but may not be able to isolate the costs to a specific pump motor.
That is why equipment-level performance tracking is so important. These data, combined with an easy way to visualize the data allows operators to pull up this information on-demand. Instead of making assumptions, the equation can be filled in with hard data, the value of the VFD can be precisely measured, and the payback period more accurately predicted.
Applying Hard Data to Proposal Estimates
Another example of equipment-level performance data leading to better decision making is when reviewing the estimated savings of a proposal. Vendors are generally able to give accurate figures around the percent savings that a retrofit will produce. Yet they are less able to translate those efficiencies into accurate dollar savings for a property.
For example, a vendor may state that replacing standard exhaust fan motors with electronically commutated motors (ECM) will increase motor efficiency by 30%. But the overall effect on yearly operating costs is simply a best estimate based on average load sizes for the building type. Often, this is taken at face value, and verified over the years through traditional M&V. Even if there is a good sense of energy consumption and costs for a property, there simply hasn’t been any way to get the data for specific systems.
These days, the M&V process can be done before installation. By isolating the costs associated with running the exhaust fans, a 30% reduction can be applied to hard data, producing an accurate number for yearly savings and payback period.
Contractor proposals have been known to be off by as much as 40%, which, depending on the size of system and the cost of the retrofit, can be the difference between an attractive payback period and one that is financially irresponsible.

Justifying the Scope of Retrofit
As mentioned earlier, not all decisions require a full yes or no. Sometimes, utilizing data to determine the needs and savings of an upgrade can result in a revised scope of work.
One common example is when installing new controls for lighting systems. Lighting controls come in a wide range of sophistication and relative costs to implement. Unlike HVAC systems which depend on a few large units, lighting is a major expense made up of many small units.
The levels of control necessary for a lighting system varies greatly depending on the current conditions and configuration of a property. Before getting to the data, operators need to evaluate a number of factors: Does the building have occupancy sensors? Where are the switches located for large shared spaces? Where are lights unnecessarily on 24/7?
The answers to these questions may lead to a long wish list of controls. However, between the controls and the electrical contractor installation costs, the full wish list could easily come out to $30,000 for one building.
The first step is to determine if the savings offered by the full suite of automated controls will provide an attractive payback period for this type of investment. Part of this consideration is whether operators will be able to take full advantage of the automation. If not, the wish list may need to be paired down to only cover the largest areas of waste.
This process is only possible with granular cost and scheduling data for each of the separate lighting areas. There are likely quick paybacks within the full scope, the trick is being able to identify these and justify them with hard data.
For example, while a full $30,000 scope may have a lengthy payback period, the data may reveal a few areas that produce the highest levels of waste. Often, a revised scope can cover to most of the original savings with a significantly lower upfront cost, leading to a much quicker return on investment.

Verifying Required Upgrades
Sometimes a building is required to perform retrofits due to regulatory requirements. In New York City, the Greener, Greater Buildings Plan includes several requirements for large buildings to install upgrades on system such as lighting and standby power generation. These requirements can mean significant investments and create a tough decision for owners and operators who need to both meet existing rules and get ahead of future regulations.
For example, because of new requirements, many owners are now considering technologies such as combined heat and power (CHP) systems. While providing significant savings over time, A CHP system can easily cost over $100,000 to install. Even a higher-level analysis on the viability of the system in a particular property can cost over $10,000.
There are a few numbers that can be easily pulled from equipment-level performance data to do an initial validation of these concepts. For example, without run time hours of operation for the HVAC system over 3,000 per year, it is easy to disqualify installing a CHP.
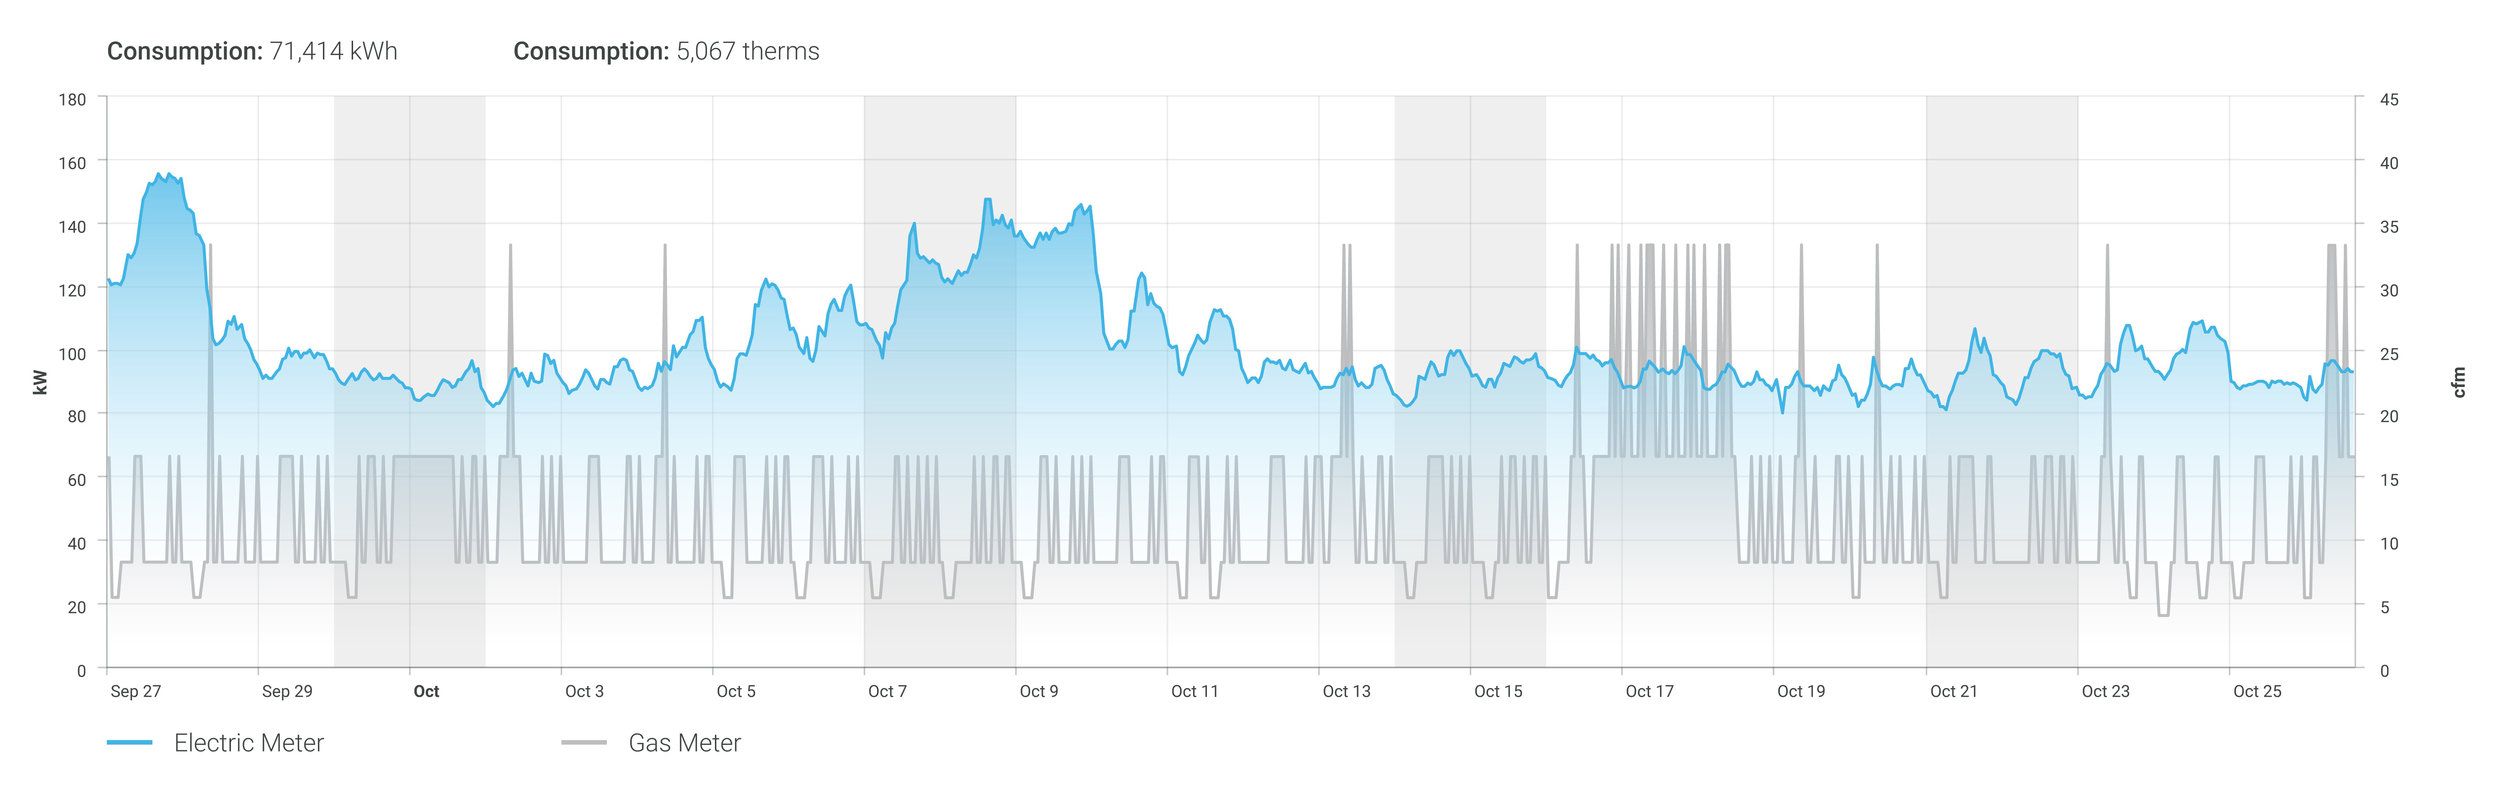
Another way to do an initial qualification of a CHP system is by calculating the “speak spread” between electricity and gas consumption. This requires aggregating the costs of both electricity and gas consumption for the last 12 months, and converting to Btu. For electricity, the conversion is the cost per kWh multiplied by 293. For gas, the conversion is the cost per therm multiplied by 10. If the cost for electricity per Btu is $12 or more than that of gas, CHP may be viable.
Unfortunately, this is a lot of legwork to do a simple initial validation – and many buildings do not have the last 12 months of utility bills readily available. This is why, in addition to equipment-level electricity consumption, it’s also important to collect a digital output of other utility consumption such as gas and water.
If installing a CHP system passes initial validation, a much deeper analysis will be required to justify such a large capital expenditure. Being able to calculate the exact run time hours, electricity costs, and gas costs can make or break the overall profitability of a property for years. Obviously, being able to carry out a measurement & verification process before installation is extremely valuable when deciding how to meet regulatory requirements.
Final Thoughts
The ability to perform the measurement & verification process on building system upgrades represents a powerful new tool for owners and operators. As more buildings install a smart building platform capable of tracking performance data at the equipment level, this strategy may become a competitive differentiator among properties.
Whether it is a minor upgrade to the motor efficiency of exhaust fans or a major investment in the building’s HVAC system, being able to isolate data to specific pieces of equipment is invaluable for the decision-making process. The real estate industry uses detailed data points to make decisions at the property acquisition level, it only makes sense that more granular data will do the same for decisions around upgrades within properties.
Enertiv's Asset Intelligence tool can be used to perform M&V before a retrofit installation or equipment upgrade. Schedule a demo today to see how!