Why Power Capacity is so Important for Industrial Leasing
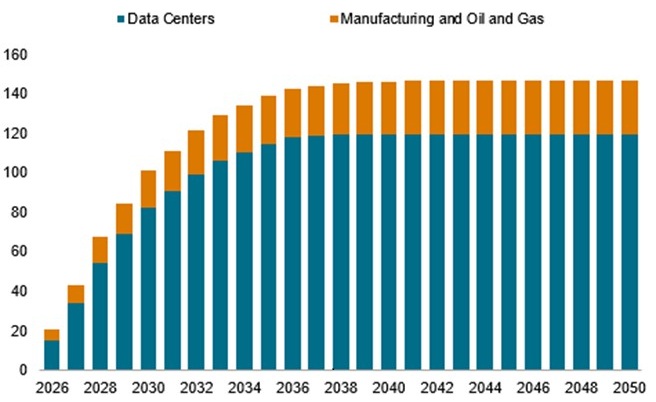
The data center boom, along with the growth of robotics, advanced manufacturing, and fleet electrification, has sent demand for electrical power soaring. As a result, power availability has become one of the most important factors in industrial leasing. Here is what owners need to know about how much power a building can support today and what it would take to expand that capacity.


For decades, industrial leasing was driven by clear height, loading, access to highways, and proximity to labor.
Now tenants are asking questions about power capacity that many brokers and asset managers simply do not have the answer to.
- • How many amps come into the building?
- • What is the transformer rated for?
- • How much of that is already spoken for?
- • If we add a robotic pick line and forty charging ports, does the service hold?
The pressure behind those questions is not subtle. The rise of data centers, the growing reliance on automation and robotics in warehousing, and the electrification of vehicle fleets have all pushed electricity demand up faster than new generation is coming online.
This shows up in energy prices. According to the EIA, commercial rates are up roughly 30% year over year in regions like Ohio, and owners should be aware of how that lands on their tenants.
But if it were simply a matter of tenants paying more for energy, it would be a peripheral issue.
Instead, it is emerging as a defining strategic priority for many owners.
Power has become a pass or fail test
In many cases, a tenant's power requirement goes well beyond what the space and the electrical infrastructure were ever designed for.
Traditional industrial spaces used to start around 200 to 400 amps per space for normal warehouse operations, plus roughly the same again for the house panel serving common areas.
Today it is common for a tenant to walk in asking for 600 to 2,000+ amps. And this is expected to grow even further.
Let's think about the portfolio in load profiles:
The tenants in the bottom three rows are the ones writing the biggest checks right now. They are also the ones most likely to walk away from a building over an electrical question.
And the grid does not help you fix it in a hurry. Utility service upgrades that once took months can now take a year or more and none of that fits inside a 60 day lease negotiation.
Which means an owner who discovers a capacity gap during lease negotiations has usually discovered it too late.
What that miss actually costs
Let's put a number on it.
Take a 100,000 SF industrial building on a five year lease at the national average asking rent of $10.32/SF. That is $1,032,000 a year, or $5,160,000 across the term.
Now lose that tenant and go find another one. The relevant cost is not every dollar spent on the replacement deal, because a renewal would also carry TI and leasing commissions. It is the incremental cost of turnover compared with renewing the existing tenant.
The incremental turnover cost consumes roughly $1,875,000 of the replacement lease's $5,160,000 value, leaving an effective value of about $3,285,000.
That works out to approximately $6.57/SF annually.
In other words, under these assumptions, replacing the tenant rather than renewing them has the same economic impact as reducing rent from $10.32/SF to about $6.60/SF.
Hold onto that frame, because it changes the math on this whole exercise. Knowing what a building can support does not have to win you a new lease to pay for itself. It only has to keep one tenant from walking.
Why audits during due diligence are not enough
Many owners have gotten wise to this and started requiring power capacity evaluations during due diligence. That is the right instinct, and it produces genuinely useful information on the assets it touches.
The problem is what it leaves out, and how fast what it captures goes stale.
Coverage is event-driven
Due diligence reaches the assets being acquired. It may also reach a building during a major redevelopment or lease-up. It does not answer the same question for the operating portfolio that may need to renew or replace tenants next quarter.
Owners cannot wait for every property to transact before learning what it can support.
Field quality varies
Different surveyors use different languages. One report says "480," the next says "480/277," the third says "480Y/277V 3PH 4W." Three ways of saying the same thing, and none of them computable side by side. Roll up thirty of those reports and you do not have a dataset, you have thirty PDFs.
The data decays
Installed capacity is a snapshot. Tenants add equipment, change shifts, electrify vehicles, and reconfigure spaces. A number that was accurate twelve months ago may no longer be the number a broker should market today.
A one-time audit can be technically correct and still become operationally useless.
Important: rated capacity is not available capacity
An audit tells you what the service is rated for (maybe from a building built 25 years ago), but cannot tell you what the tenant is drawing and cannot predict what they will draw next year as they build out the space.
There are actually three different numbers sitting behind the phrase "how much power does this building have," and they are not so close to each other.
Nameplate capacity
What the transformer and main breaker are rated for. On a 4,000 amp service at 480Y/277V, that is roughly 3,326 kVA. It is the biggest number in the file, and it is the one owners are most tempted to put in a marketing package.
Usable capacity
The National Electrical Code treats a load running three hours or more as continuous, and continuous loads are limited to 80% of the circuit rating. That same 4,000 amp service gives you about 2,660 kW of continuous load, not 3,326. Miss this and a tenant's electrical engineer will correct you in one email.
Available capacity
Usable capacity minus what is already being drawn at peak. This is the only number a tenant cares about, and it is the only one you cannot get from a nameplate. It requires measured demand, and it needs an as-of date attached to it.
Right, so how to collect these?
1. Installed capacity: what the building is rated for
This is the physical inventory: what the infrastructure was built to deliver.
- • Record amperage and voltage ratings at the service, building, and unit level
- • Check the transformer kVA rating
- • Document the location, configuration, and condition of switchgear and distribution panels
- • Note feed type, number of feeds, phasing, and whether there is redundancy
- • Capture meter account numbers so the electrical record ties back to the utility record
- • Photograph every nameplate, and where a nameplate cannot be read, log it as not observable with a reason and a photo rather than leaving the field blank
How it gets collected: This can be determined with a "snapshot" data collection process at the facility.
2. Operational load: what is actually being drawn
- • Calculate total connected load and peak load
- • Apply the continuous load factor, because circuits should not sustain 100% of rated capacity
- • Compare current load against both the rating and the incoming tenant's stated requirement
- • Look at the trend, not one month, so you know the seasonal peak rather than the average
How it gets collected: two ways.
- 1) You can estimate it from an equipment inventory. Count the compressors, conveyors, RTUs, and charging stations and add up the nameplates. That gets you in the neighborhood, and in a lot of buildings the neighborhood is enough for a first conversation.
- 2) Or you can measure it. Where interval data exists (e.g., collected via shadow metering at the main distribution panel), you get actual demand rather than a calculation.
Portfolios with measured demand have a built-in edge here. They know the rated capacity and exactly what the operational load is, which is the only combination that produces an available capacity number an owner can defend.
3. Utility position: what the grid can actually deliver
- • Confirm available service capacity at the property
- • Get lead times and cost estimates for a service upgrade
- • Ask about interconnection requirements and any commitments the utility needs from a tenant
- • Document who you spoke with, the account, and what they said
How it gets collected: by contacting the utility directly.
What a scalable program looks like
Four things have to be true at the same time:
- 1) One schema, fixed before anybody walks a building. Volts, amps, kVA, MVA, dates as YYYY-MM-DD. This is where software can be really helpful to prevent capture errors and maintain a digital inventory.
- 2) Demand data tied to the same asset records. This is what turns a static rating into a live available capacity figure, and what keeps it current as tenants change how they use the space.
- 3) Engineering review before anything ships. Somebody who is not the surveyor checks completeness, voltage and phase alignment, and whether the calculations hold up. Ideally while the crew is still in the market, so gaps get a return visit instead of a phone call six months later. This can also be automated.
- 4) A maintained system of record. Versioned, queryable, and pushed into whatever system the leasing and asset management teams actually open every morning. Re-verification becomes a process you run, not a procurement you repeat.
Then sequence the work rather than trying to cover everything at once.
Very few organizations have all four of those running together. Engineering firms are strong on the third and rarely touch the rest. Software platforms own the fourth and never go to the field. Ask any partner which of the four they actually do, because that answer is what decides whether the number still means anything twelve months from now.
What this looks like on a real building
Here is one we ran in July 2026. Large distribution facility in the Inland Empire, single tenant, national consumer products operator, institutional owner. We surveyed the electrical infrastructure on site, then pulled the trailing twelve months of 15-minute interval data off the building's meters.
Installed side, from the field survey:
Measured side, trailing 12 months of 15-minute interval data:
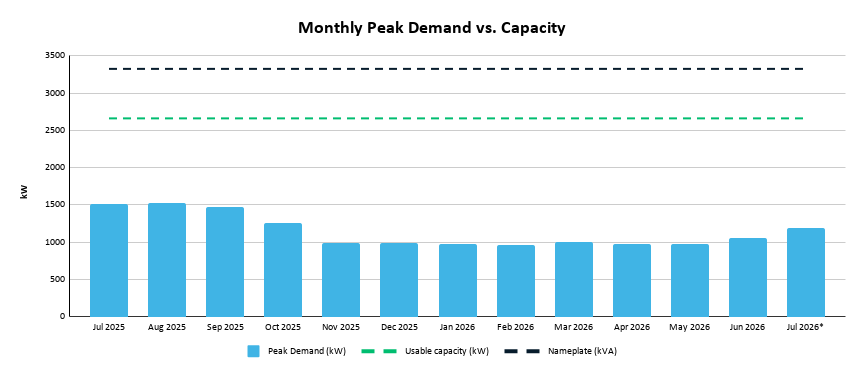
Worst month of the year, with the tenant running full tilt through a Southern California August, the building still had 1,141 kW free. Most months it was closer to 1,500 kW.
Turn the analysis into action
Once the numbers exist, the point is not to upgrade every building, but to sort them.
- 1) Assets that can take a higher-density tenant today. Real capacity sitting unused. Put the number in the flyer next to clear height and dock doors, and give the brokers the chart behind it.
- 2) Assets that can get there through optimization. Where the gap is modest, the cheapest capacity in the building is the capacity already being wasted: equipment schedules, cooling setpoints and startup sequences. Past the operational tuning there are projects: LED, HVAC efficiency, smart controls, solar, storage. Every kilowatt off the peak is a kilowatt of capacity you did not have to buy from the utility, and it lands in weeks rather than quarters.
- 3) Assets that need a deliberate path to more power. Sometimes a service upgrade is unavoidable and the move is to start early rather than start when a tenant asks. An engineering assessment, an opinion of probable cost, and a utility conversation with real lead times attached, so the asset has a known path instead of an open question.
Worth naming the second payoff. For industrial portfolios, decarbonization is a high-quality leasing and retention strategy by another name.
To lease well, you have to know the space's power capacity. To renew well, asset managers are always hunting for positive, low-friction touch points with tenants mid-lease. Helping a tenant find the capacity to add automation or electrify a fleet is about as good as those touch points get.
And in the process, while helping the tenant hit their goals, you decarbonized the building.
Bottom line
Power availability has become one of the top three factors in industrial site selection. For a growing number of tenants, it is the first question they ask.
Replacing rather than renewing a 100,000 SF tenant can cost around $1.9 million under these assumptions. If knowing your power capacity holds onto one tenant you would otherwise have lost, the whole initiative has already paid for itself.
The good news is that collecting this at scale is a solved problem. It takes a structured field survey, demand data tied to the same asset records, engineering review, and a system of record that stays current. And the goal is not to upgrade everything. It is to know which assets can take a higher-density tenant today, which can get there by freeing up capacity already being wasted, and which need a real path to more power starting now instead of during a lease negotiation.
Standing that up from scratch is a real project. Working with a partner who has spent more than 15 years digitizing electrical infrastructure and measuring load is a much shorter road to the same answer.
Talk it through with our team
Enertiv pairs a structured survey of each building's electrical infrastructure with its actual measured demand, then turns both into a capacity versus demand picture for every location, produced building by building and rolled up across the portfolio.
If you want to see what that would look like on your assets, grab a time below.