New Feature: Variance Tracking Charts
We've been heads down building tools to make portfolio utility management and benchmarking easier. Today we're rolling out one more: Variance Tracking Charts.
This one feels special because it started as a direct client request. One of the perks of having an AI-first development team is that features like this go from ask to production in record time.
Here's what you can do with Variance Tracking Charts:
Portfolio-Wide Variance at a Glance See every property's energy, water, or emissions variance in a single heatmap view.
Month over Month and Year over Year Comparisons Spot trends across time periods and catch usage creep before it becomes a problem.
Filter by Utility or View Combined Usage Drill into a specific utility or get the full combined picture
Anomalies Highlighted Automatically Unusual spikes or drops are flagged automatically so the properties that need attention rise to the top.
Data Gaps Flagged in One View Missing data surfaced right alongside your numbers, so you always know what you're working with.
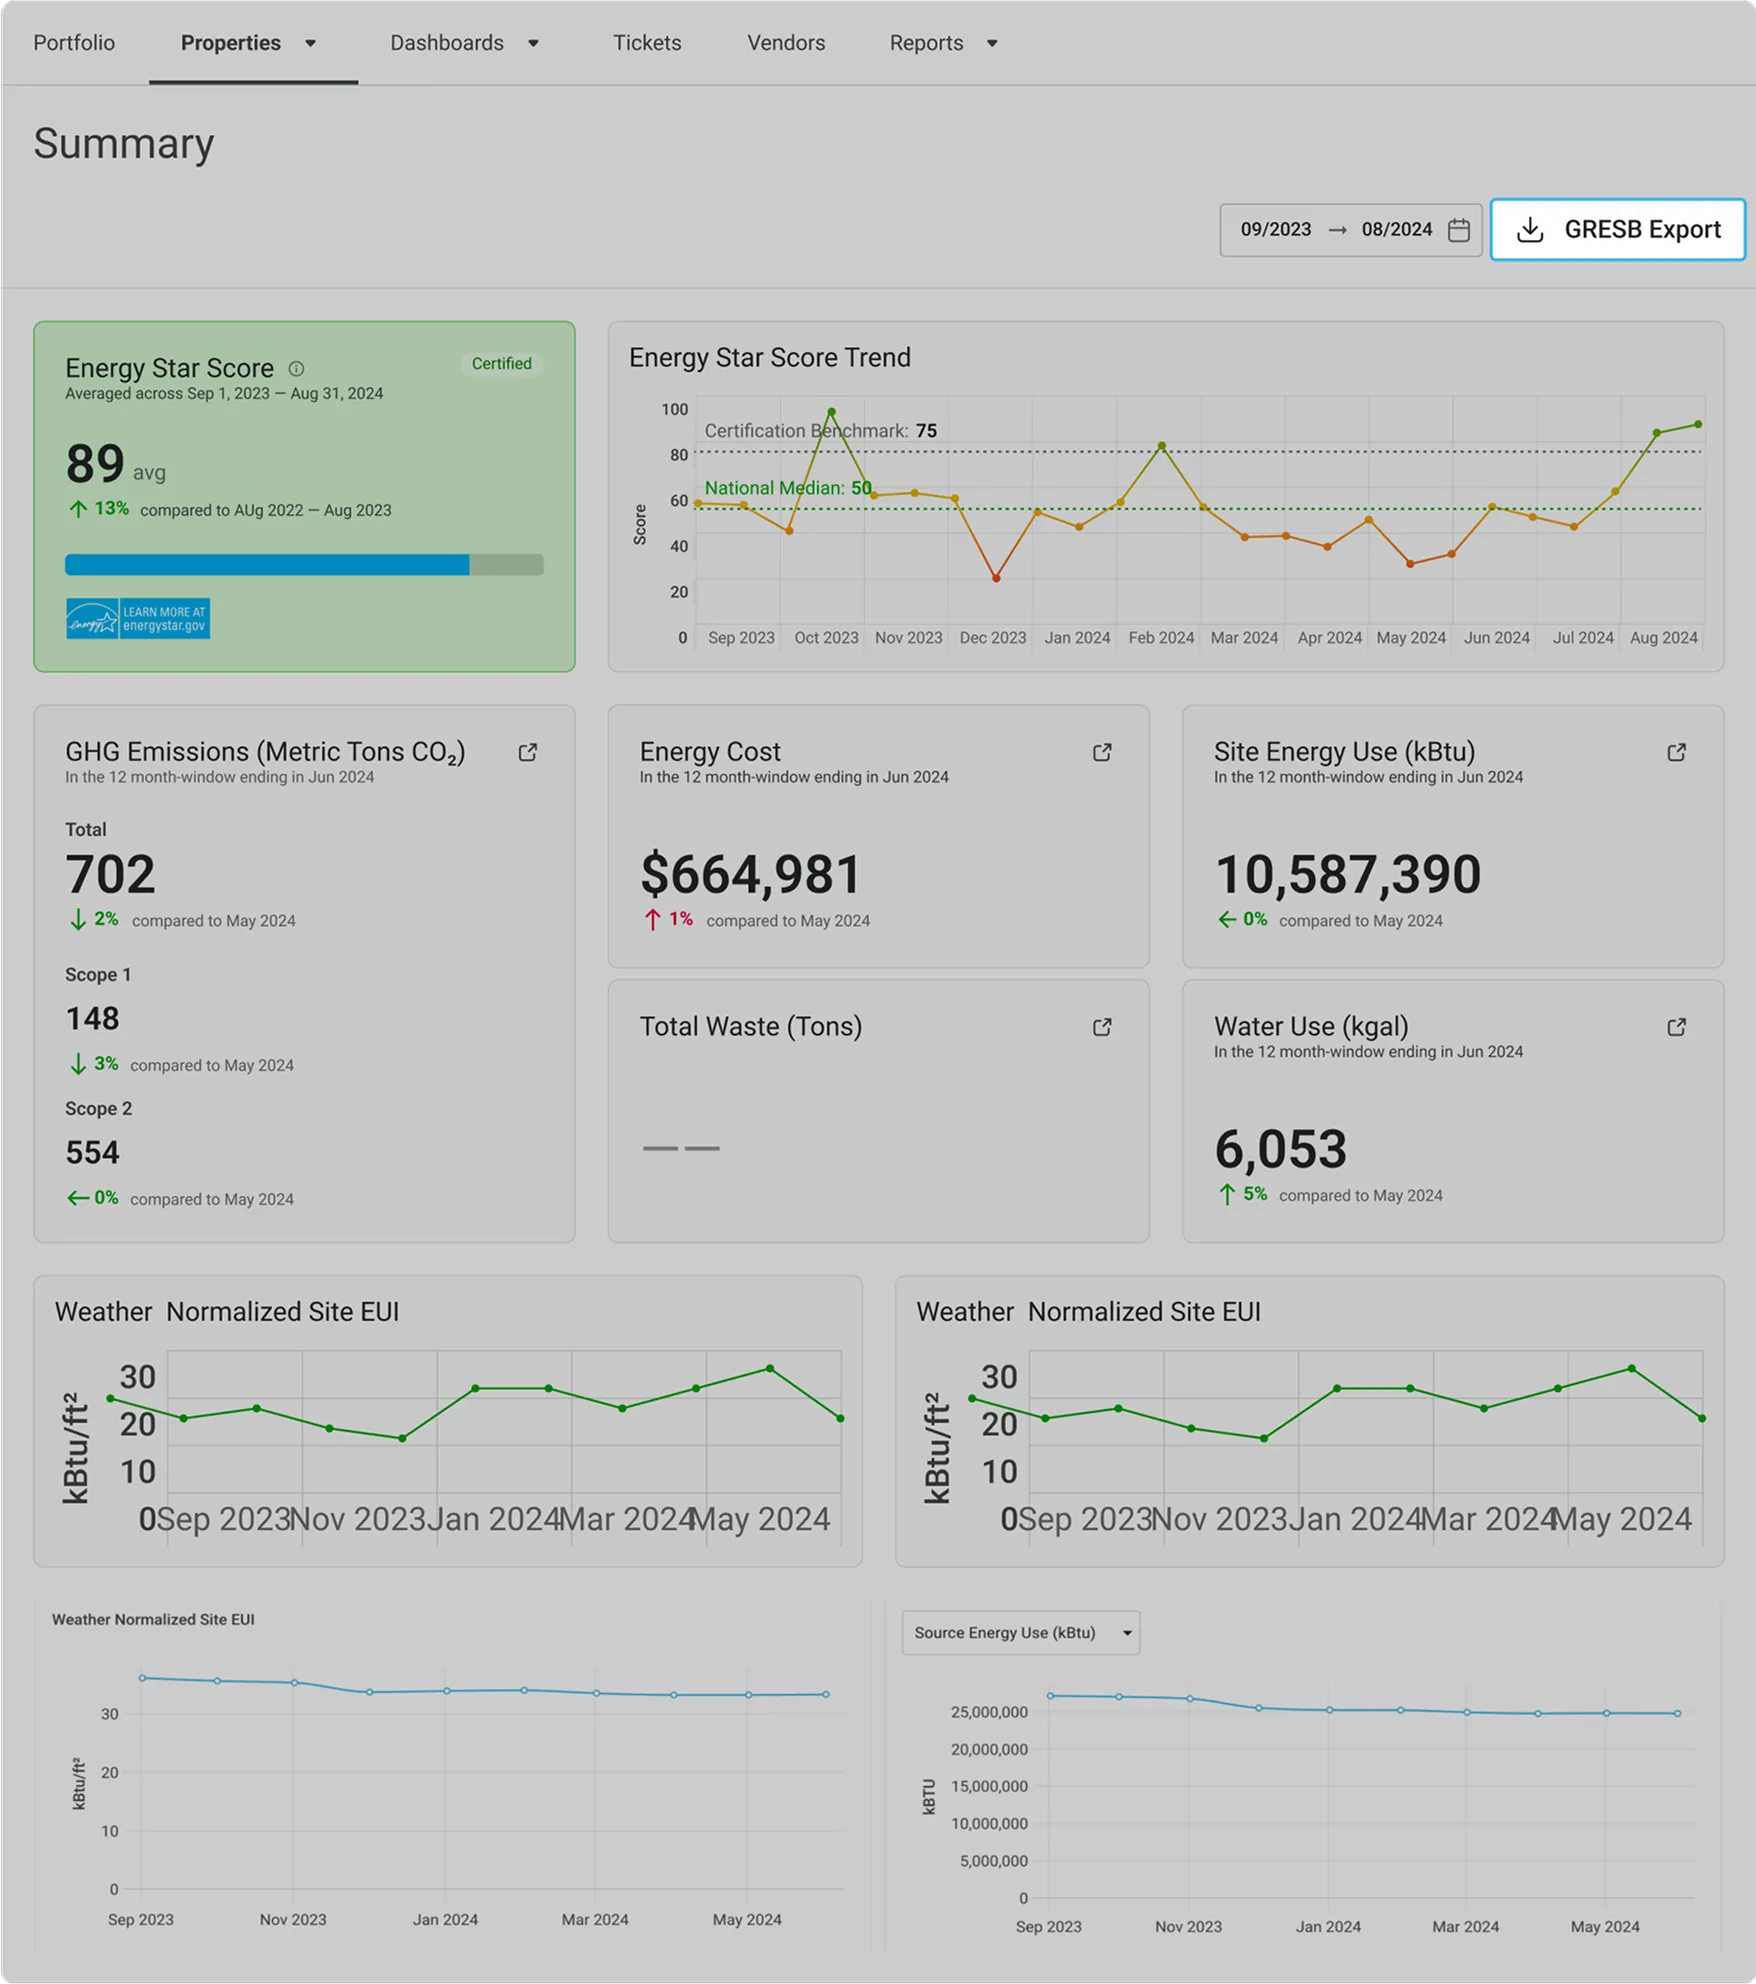
Introducing Enertiv’s new benchmarking capabilities
With benchmarking season around the corner, we're rolling out new capabilities in Enertiv designed to streamline your benchmarking and reporting process.
From multi-year comparisons to GHG emissions accounting, these updates give your team more control over how performance is tracked, presented, and acted on.
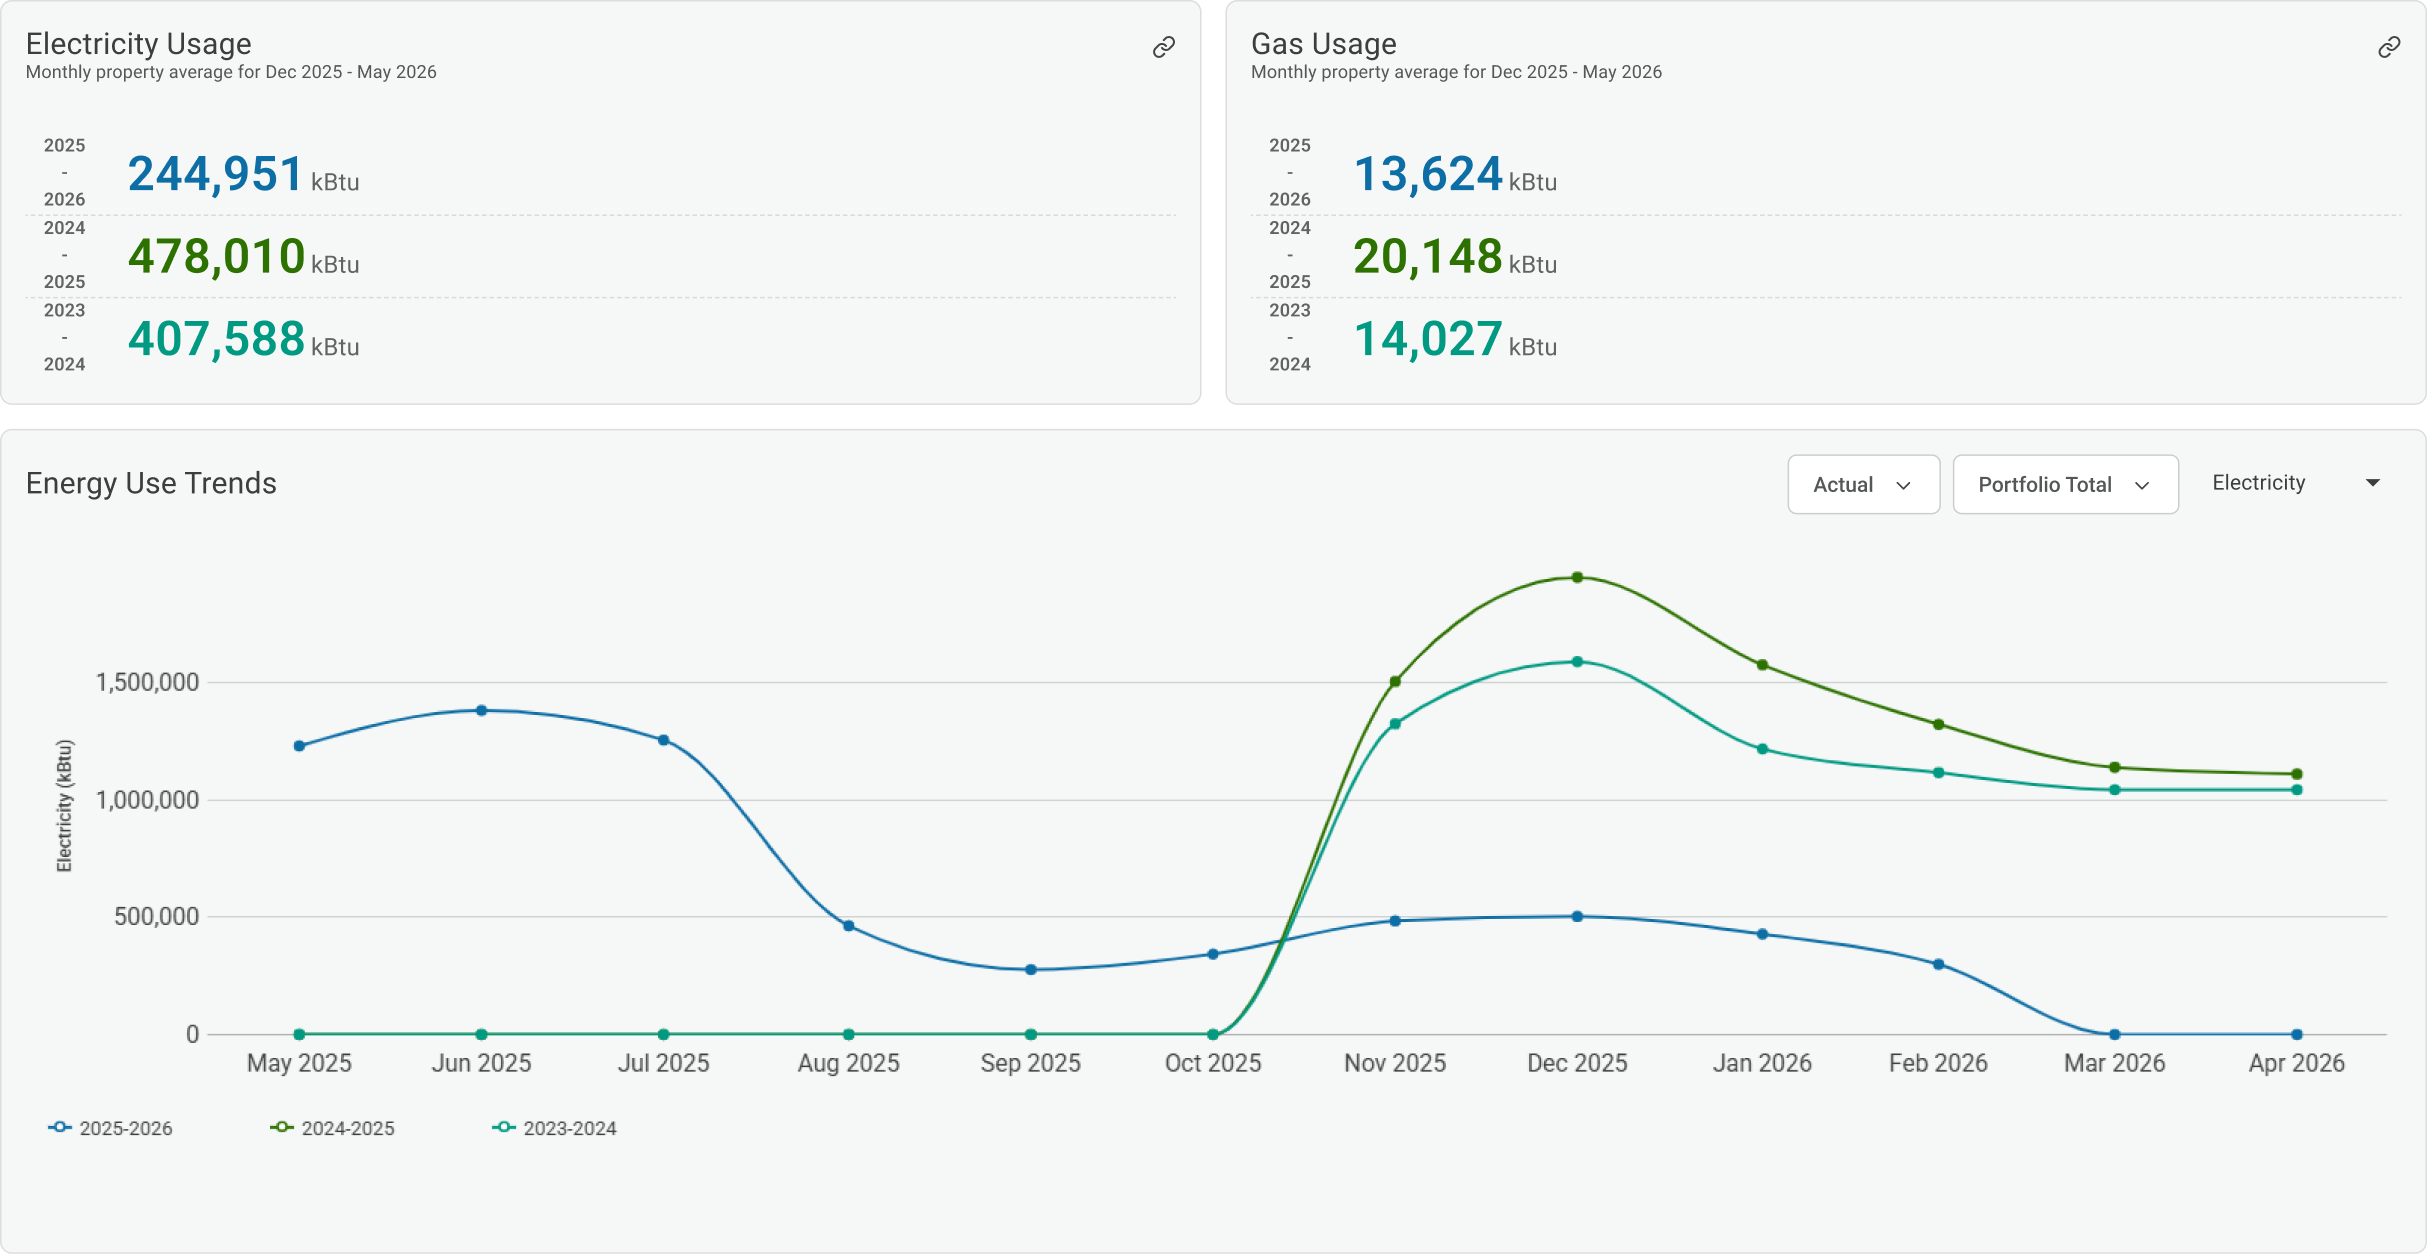
Multi-Year Comparisons
Compare properties side by side using normalized metrics like energy use, EUI, and Energy Star score so you can show real, credible progress over time.
New Portfolio, Fund, and Property Level Views
New dashboards to track performance across your entire portfolio, spot outliers, and prioritize the assets that need attention before submissions.
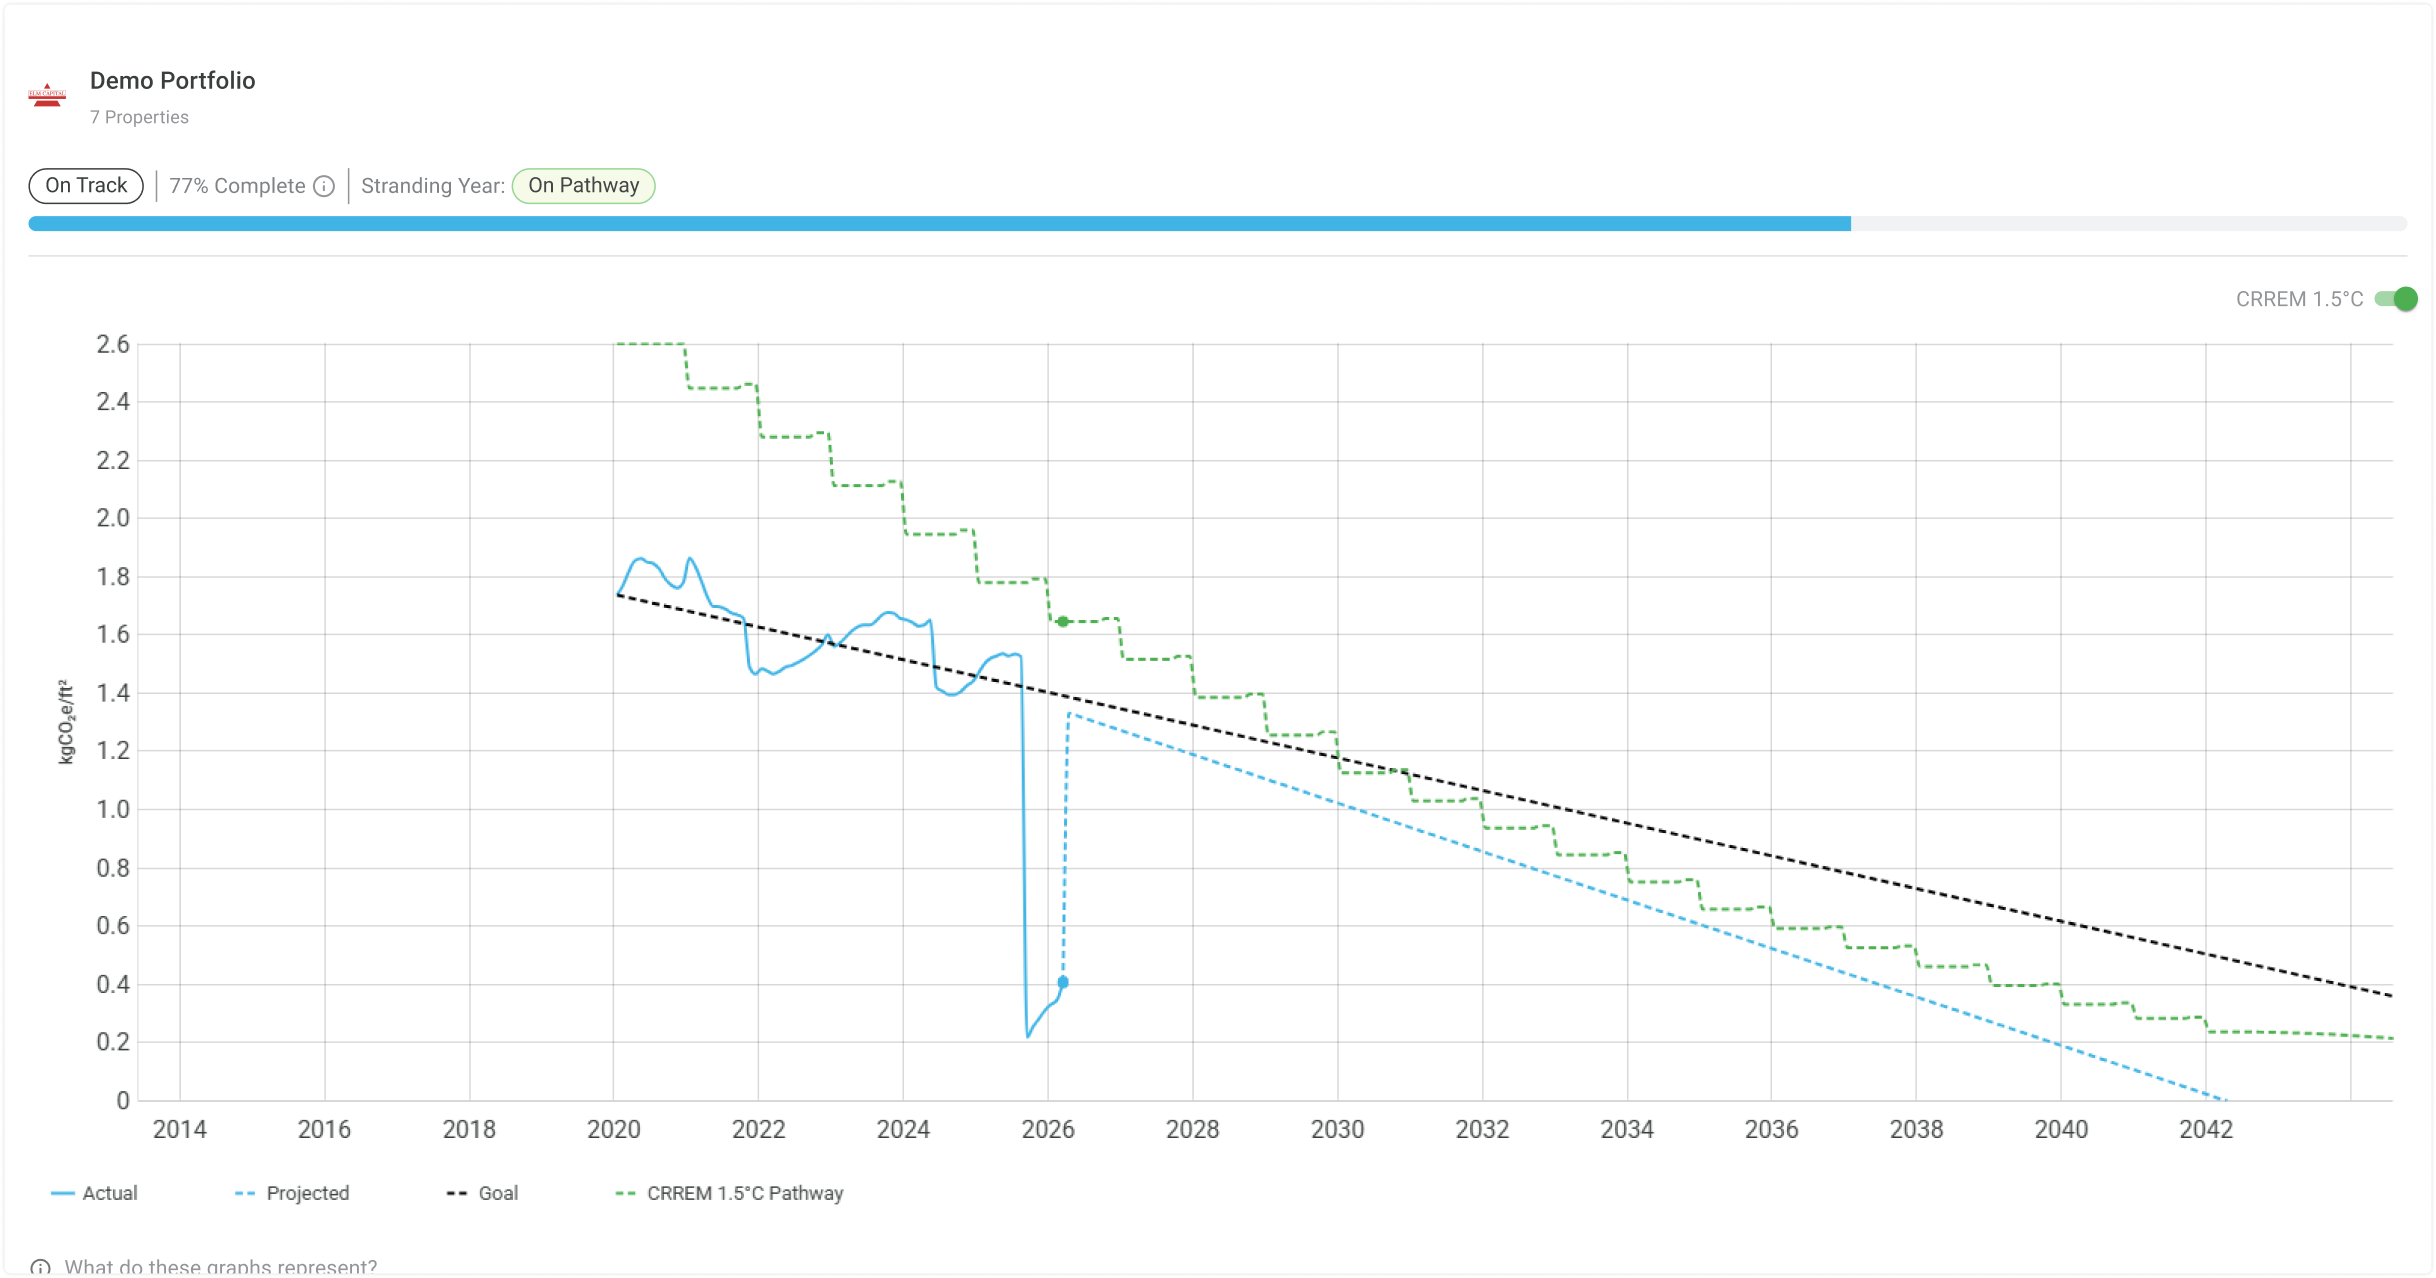
KPI Configuration & CRREM Tracking
Goal-setting with configurable KPIs for emissions, energy, water, and waste. Track progress against CRREM pathways with alerts for performance deviations.
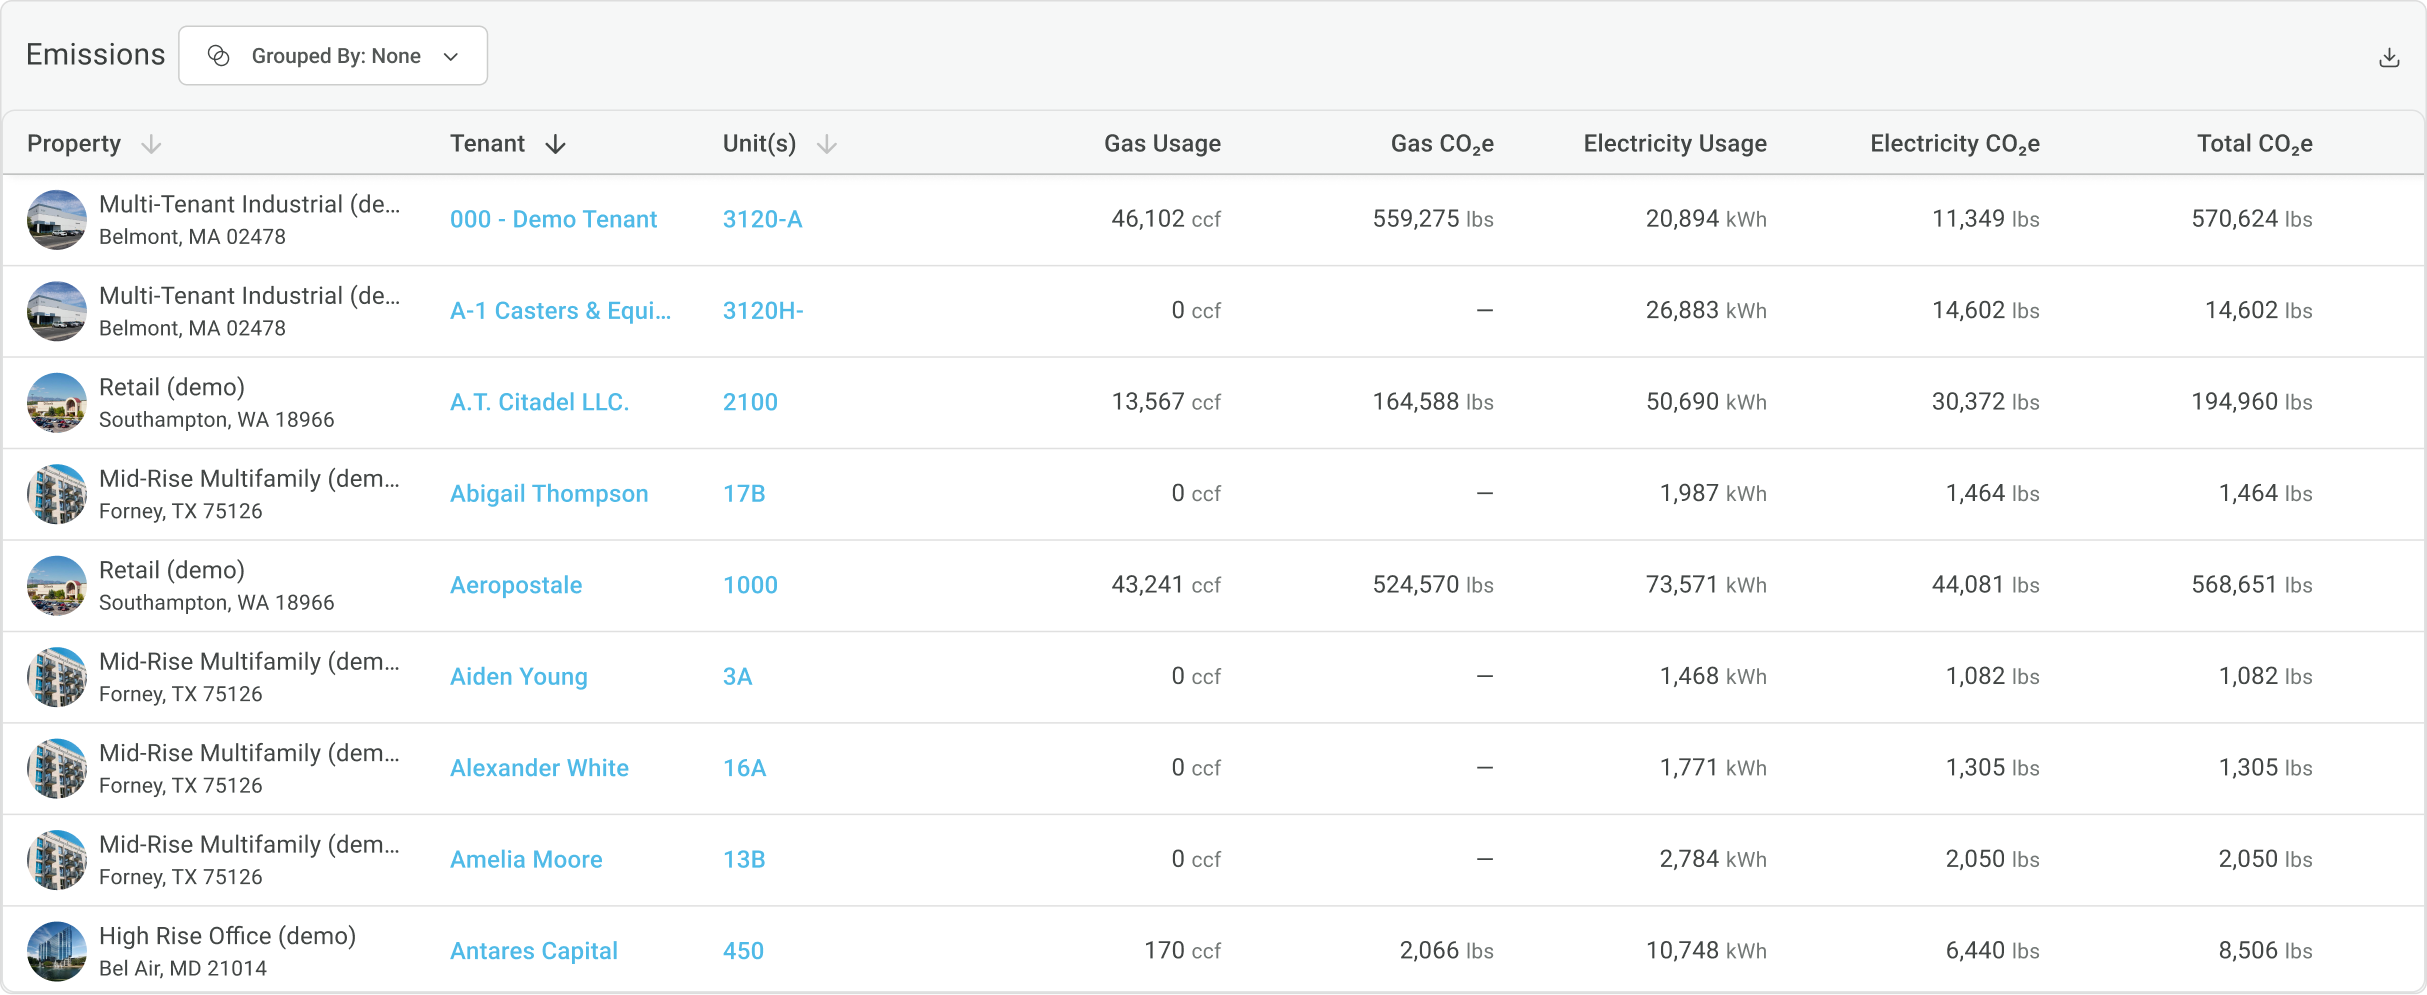
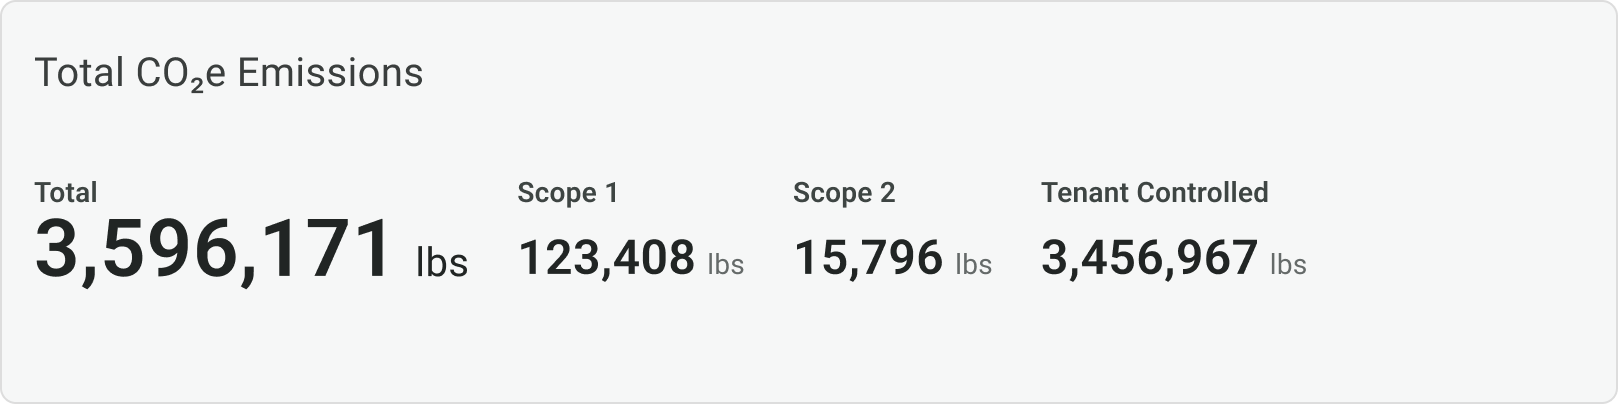
GHG Emissions Accounting
Clear, separated visibility into Scope 1, Scope 2, and tenant-controlled emissions with regional factors built in.
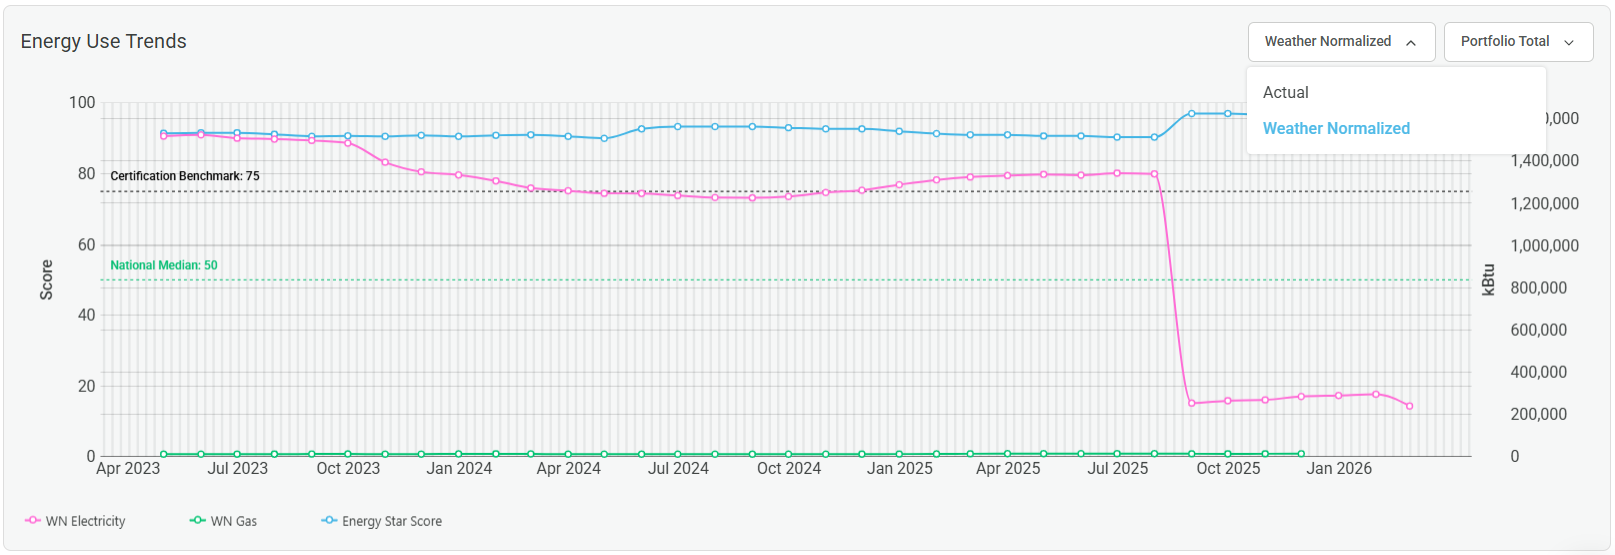
Weather Normalization Toggle
Switch between actual and weather-normalized views for energy use, EUI, and other metrics at any level of the hierarchy, without affecting underlying data.
And there's more!
• Automatic Unit Conversions: Metrics now adapt to local units across regions automatically. Teams operating across the US and Canada no longer need to manage unit discrepancies manually.
• Enhanced Utility Bill Anomaly Detection: Year-over-year anomaly detection with varying severity levels surfaces billing irregularities and consumption shifts earlier, with enough context to act on them before they affect submissions.
AI-assisted Nameplate Recognition
Enertiv is now leveraging AI to make your deployments 10x faster and less prone to error.
We’re constantly improving to ensure our clients have a great experience — and AI plays a key role in that process. Now, during deployments that require us to be on-site, our digitization process includes an AI-powered nameplate recognition feature to onboard equipment in the field.
It’s a simple idea with a big impact: instead of typing in make, model, and serial numbers manually, we’re now using computer vision (OCR) to scan and extract that data directly from equipment images.
Key Highlights:
- Automated Data Capture: Extracts all important information from equipment nameplates using OCR.
- Improved Data Accuracy: Minimizes human error.
- Faster Asset Onboarding: Accelerates the equipment survey process and supports more complete asset records.
This is just one of several updates we’ve rolled out recently to ensure our implementation process continues to set the standard. We’re now better, faster, and more scalable than ever.
We’re also bringing innovation tosoftware-only deployments: expanding and training our onboarding team, automating key workflows using AI, and releasing new software features to help you manage your portfolio data more easily.
Portfolio-Wide Data Coverage View
Utility data coverage is a critical metric, yet most sustainability teams only have a vague sense of where they stand until annual reports are finalized.
We’re changing that.
Enertiv now offers real time portfolio-wide visibility into utility data coverage. In other words, you’ll always know if your data is 50% or 100% complete (and exactly where to improve) before reporting season hits.
Here's what's new
- Utility Type Breakdown
See coverage percentages by gas, electricity, water, and waste across your entire portfolio and for each individual property. - GRESB Readiness
Assess how data completeness will impact your upcoming sustainability reporting. - Prioritized Action
Identify underperforming buildings and prioritize data coverage improvements efficiently.
GRESB (and other sustainability benchmarks) keep raising the bar each year. By tracking data completeness year-round, you’ll be prepared for whatever new requirements come your way.
Alternative ESG framework support
Preparing ESG reports across multiple frameworks shouldn’t require an army of spreadsheets.
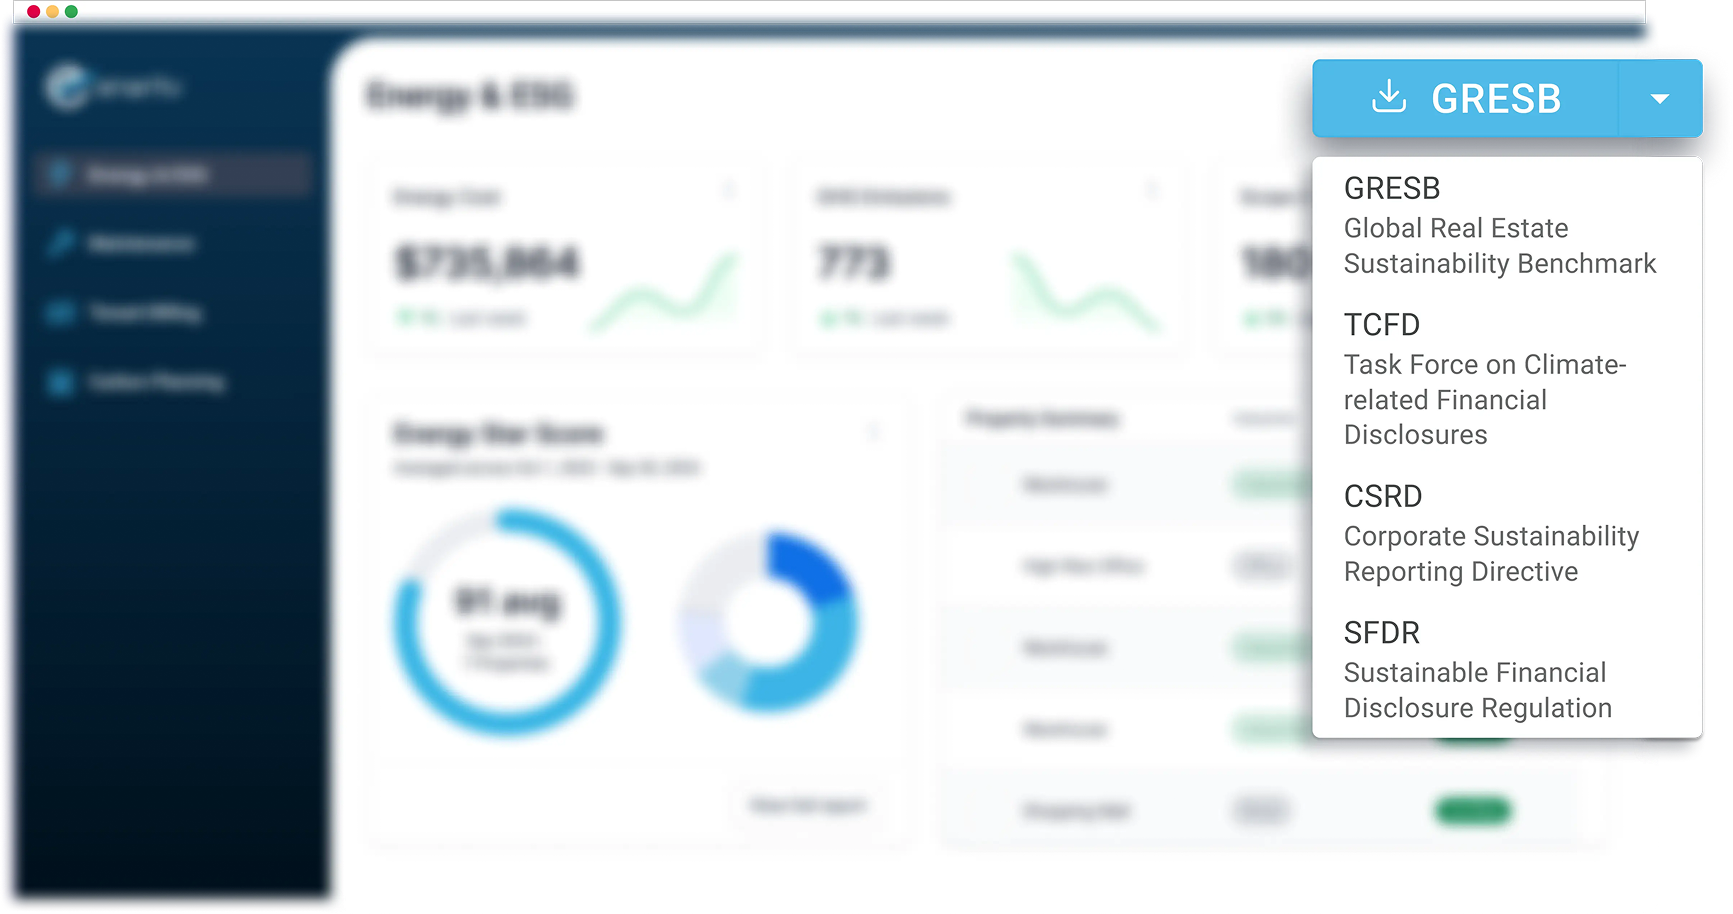
That’s why we’ve expanded our one-click exporter to cover SFDR, CSRD, and TCFD — alongside GRESB.
These reports come pre-filled with the utility and ESG data you collect through Enertiv, including emissions, energy use, and other key metrics. Everything is verified for accuracy, checked through our QA process, and ready to go.
This is one more way we’re helping teams simplify reporting and focus on what really moves the needle.
New Feature: LOA Management
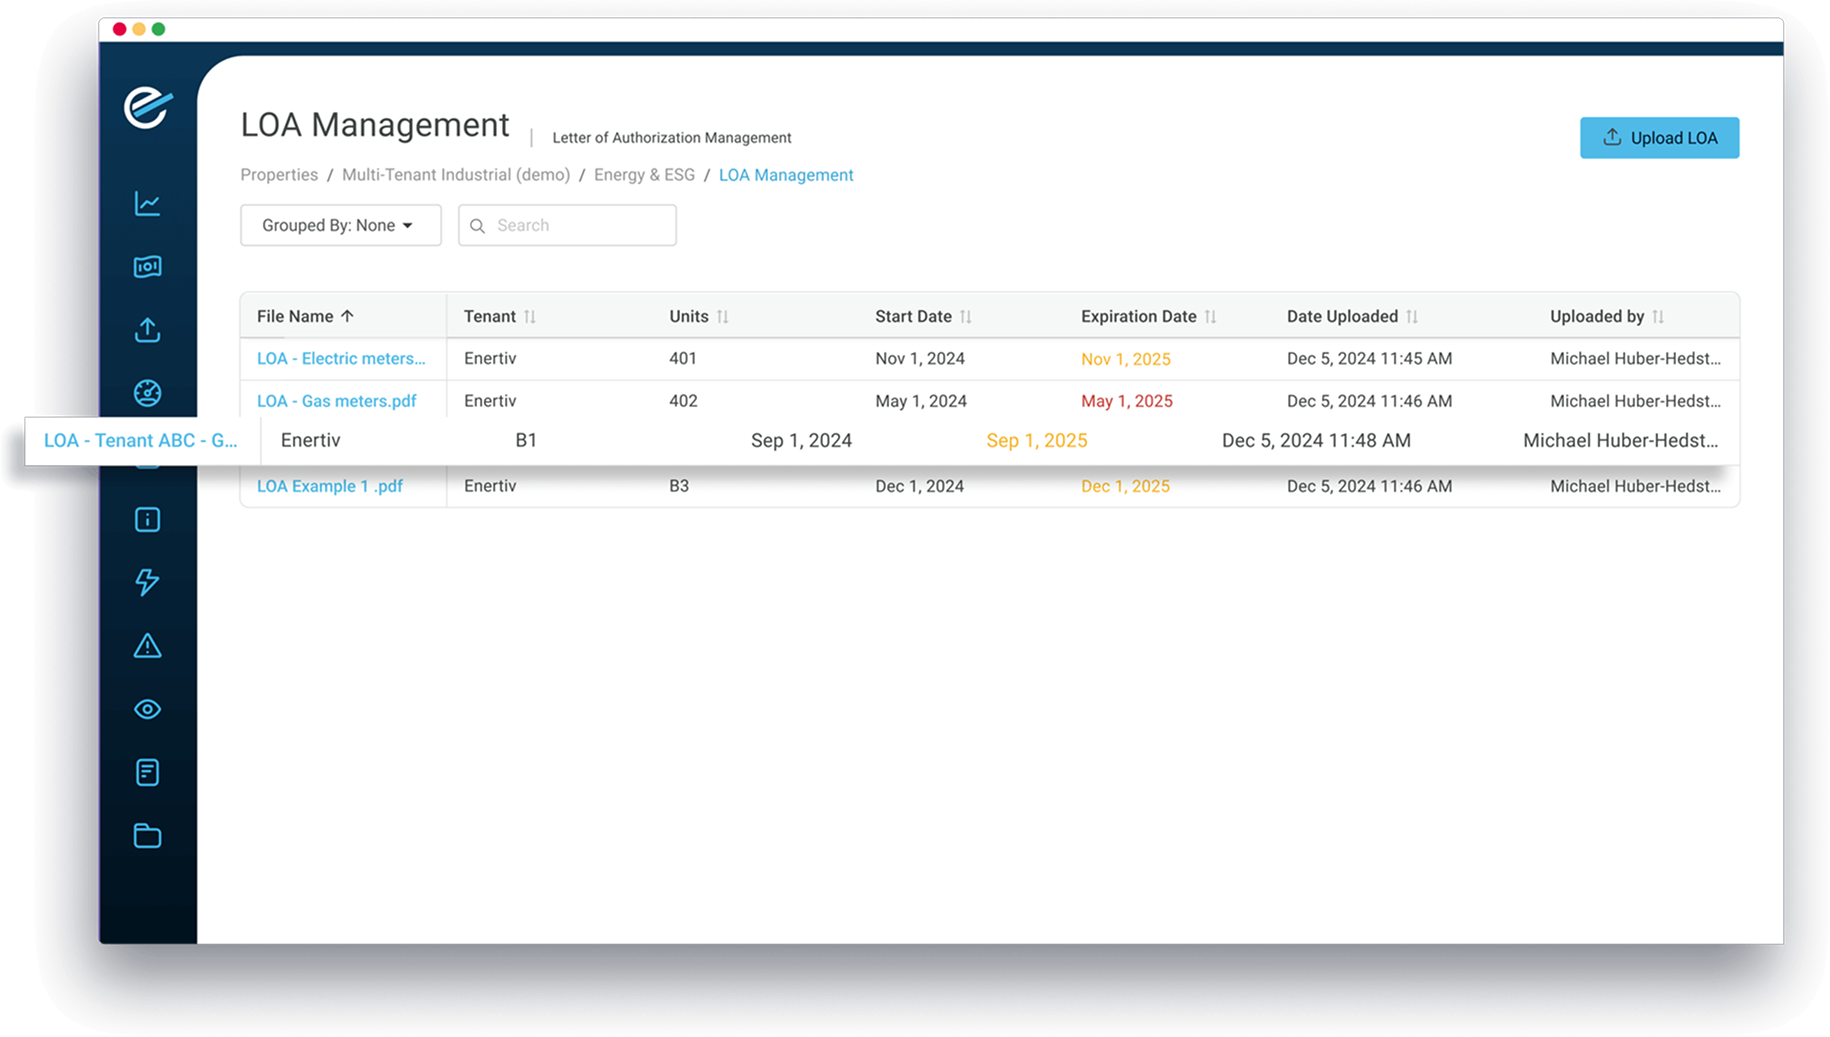
Managing dozens of LOAs across tenants and properties isn’t exactly seamless. Between spreadsheets, missed deadlines, and expired documents, it’s easy for things to fall through the cracks.
That’s why we’ve launched a new feature in the Enertiv platform: LOA Management.
Now you can:
- Organize all LOAs by meter, tenant, or unit
- Track expiration dates with automatic reminders
- Avoid disruptions caused by expired or missing authorizations
This gives you better visibility, less manual work, and uninterrupted access to the utility data you need.
Improvements to our ESPM Integration
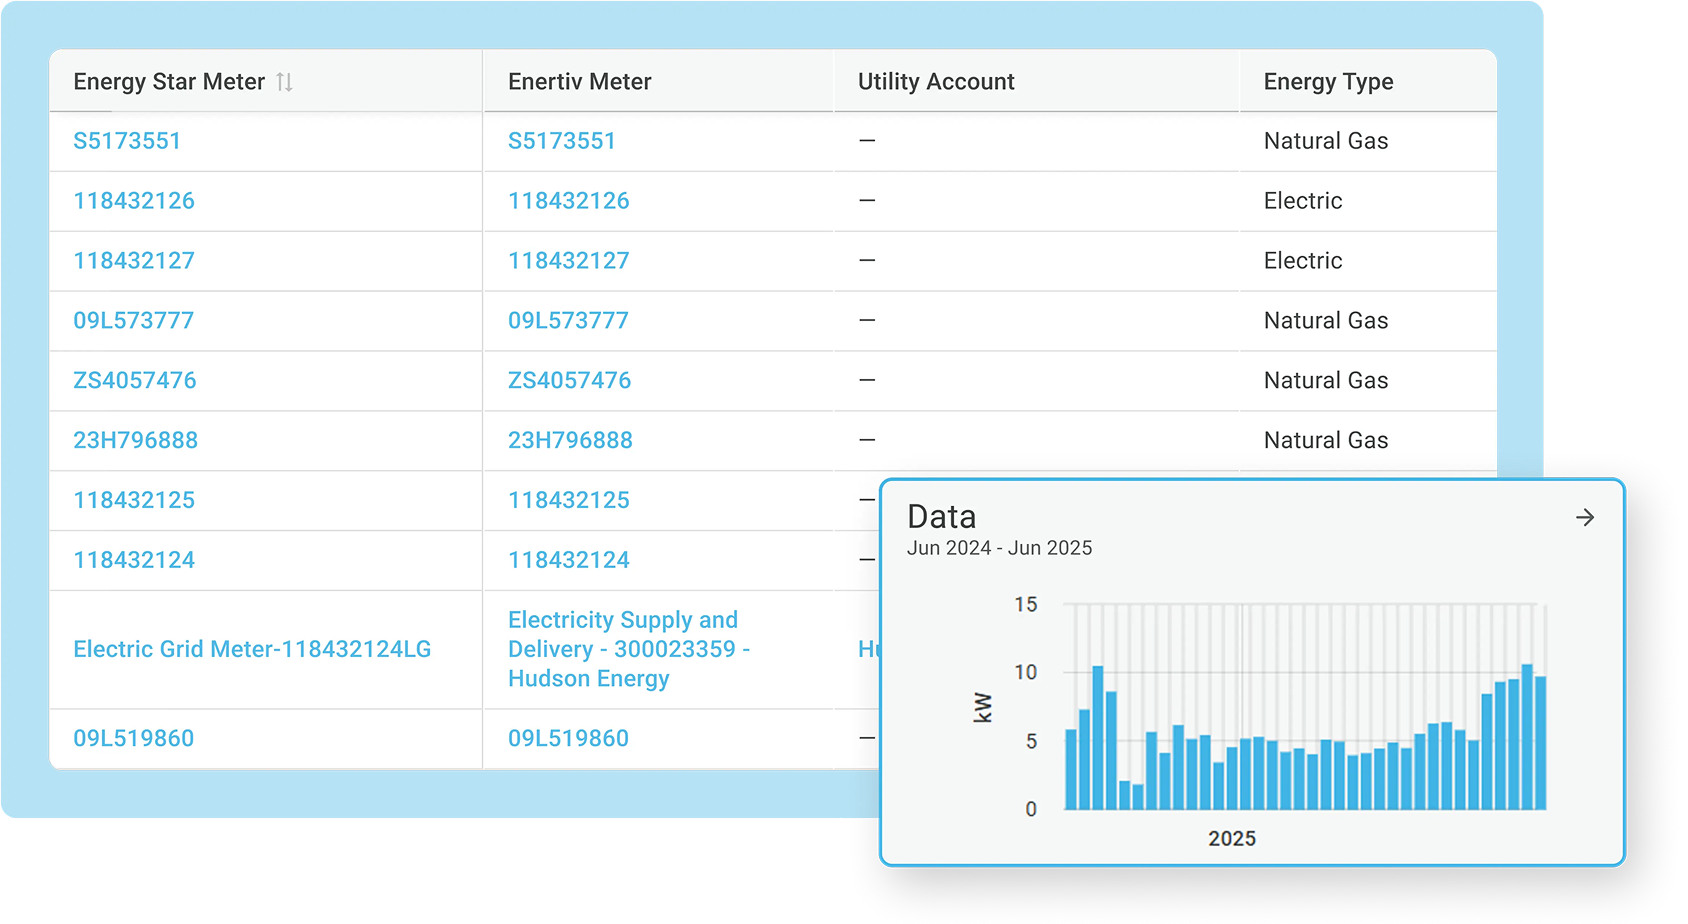
We’ve made important improvements to our integration with Energy Star Portfolio Manager.
You can now view and manage meter-related data directly within the Enertiv platform, without having to access ESPM. This brings speed and simplicity to managing your properties.
Solar Meters
We now support solar meter tracking and integration with ESPM. Users can enable solar meters, push solar generation data, and ensure accurate treatment of REC (Renewable Energy Credit) ownership status.
This feature streamlines how onsite renewable energy is reported and ensures compliance with Energy Star’s sustainability requirements.
Meter Connection
Users now have full visibility into their ESPM meter connections. You can instantly see which meters are linked, whether data is flowing correctly, and easily identify any gaps or overlaps in reporting.
You can also monitor all alerts generated by ESPM directly in Enertiv, alongside other alerts across your portfolio.
New Module: Carbon Planning
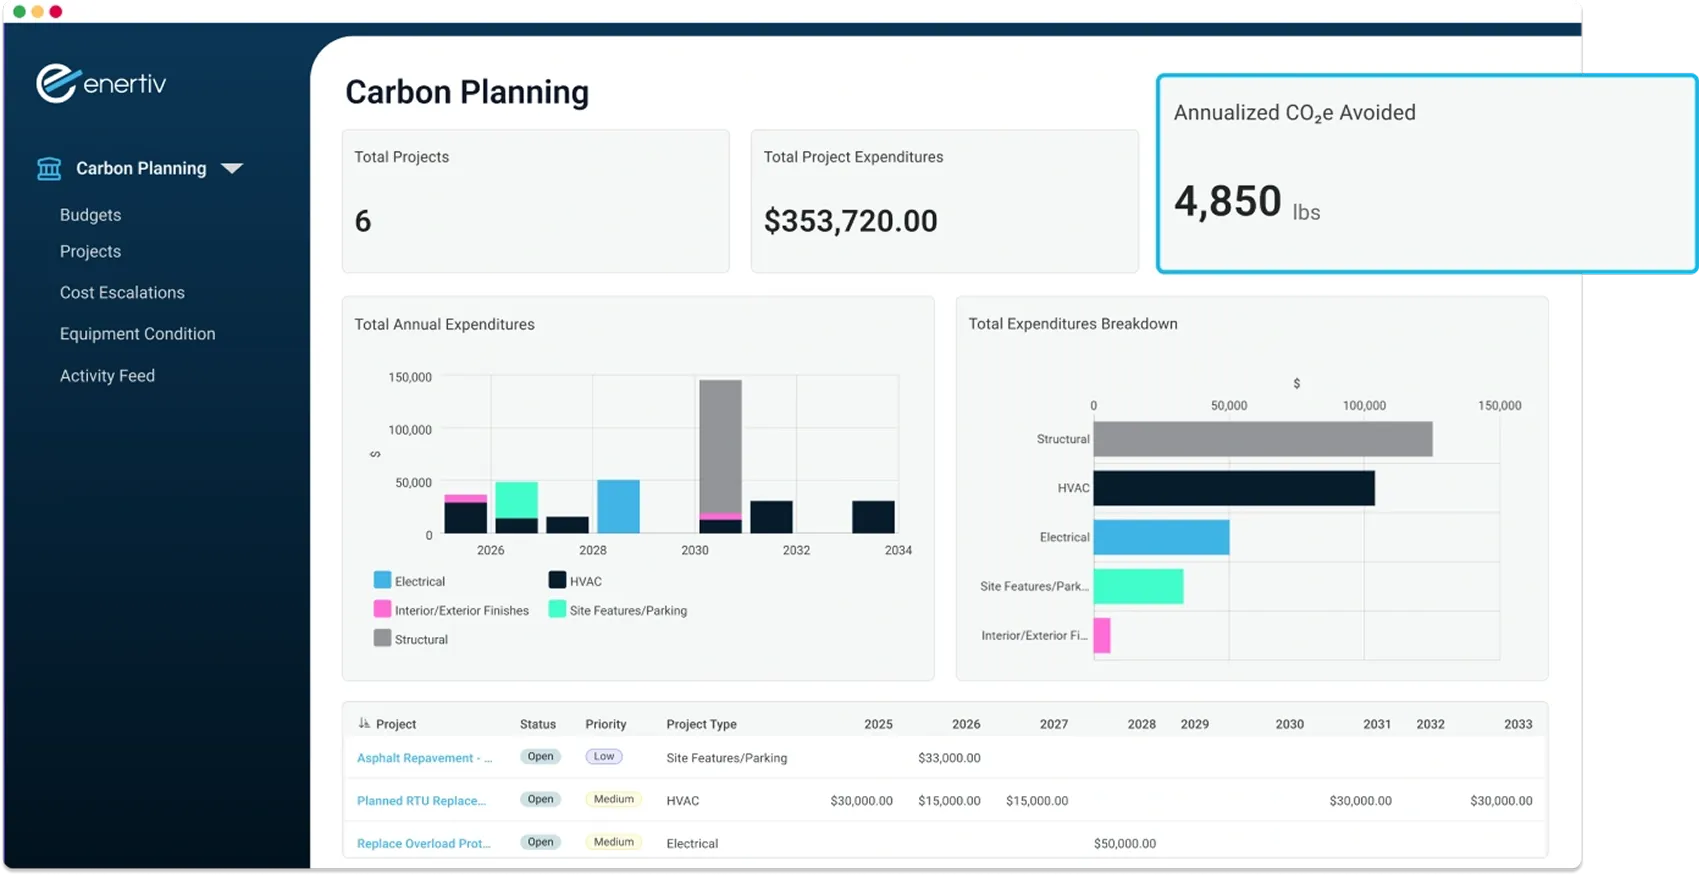
Our new Carbon Planning module helps you connect project spending with carbon reduction targets. Track initiatives by cost or carbon impact, roll them into a broader budget, and see how your investments contribute to decarbonization — all in one place.
What you can do with Carbon Planning:
New Module: Carbon Planning
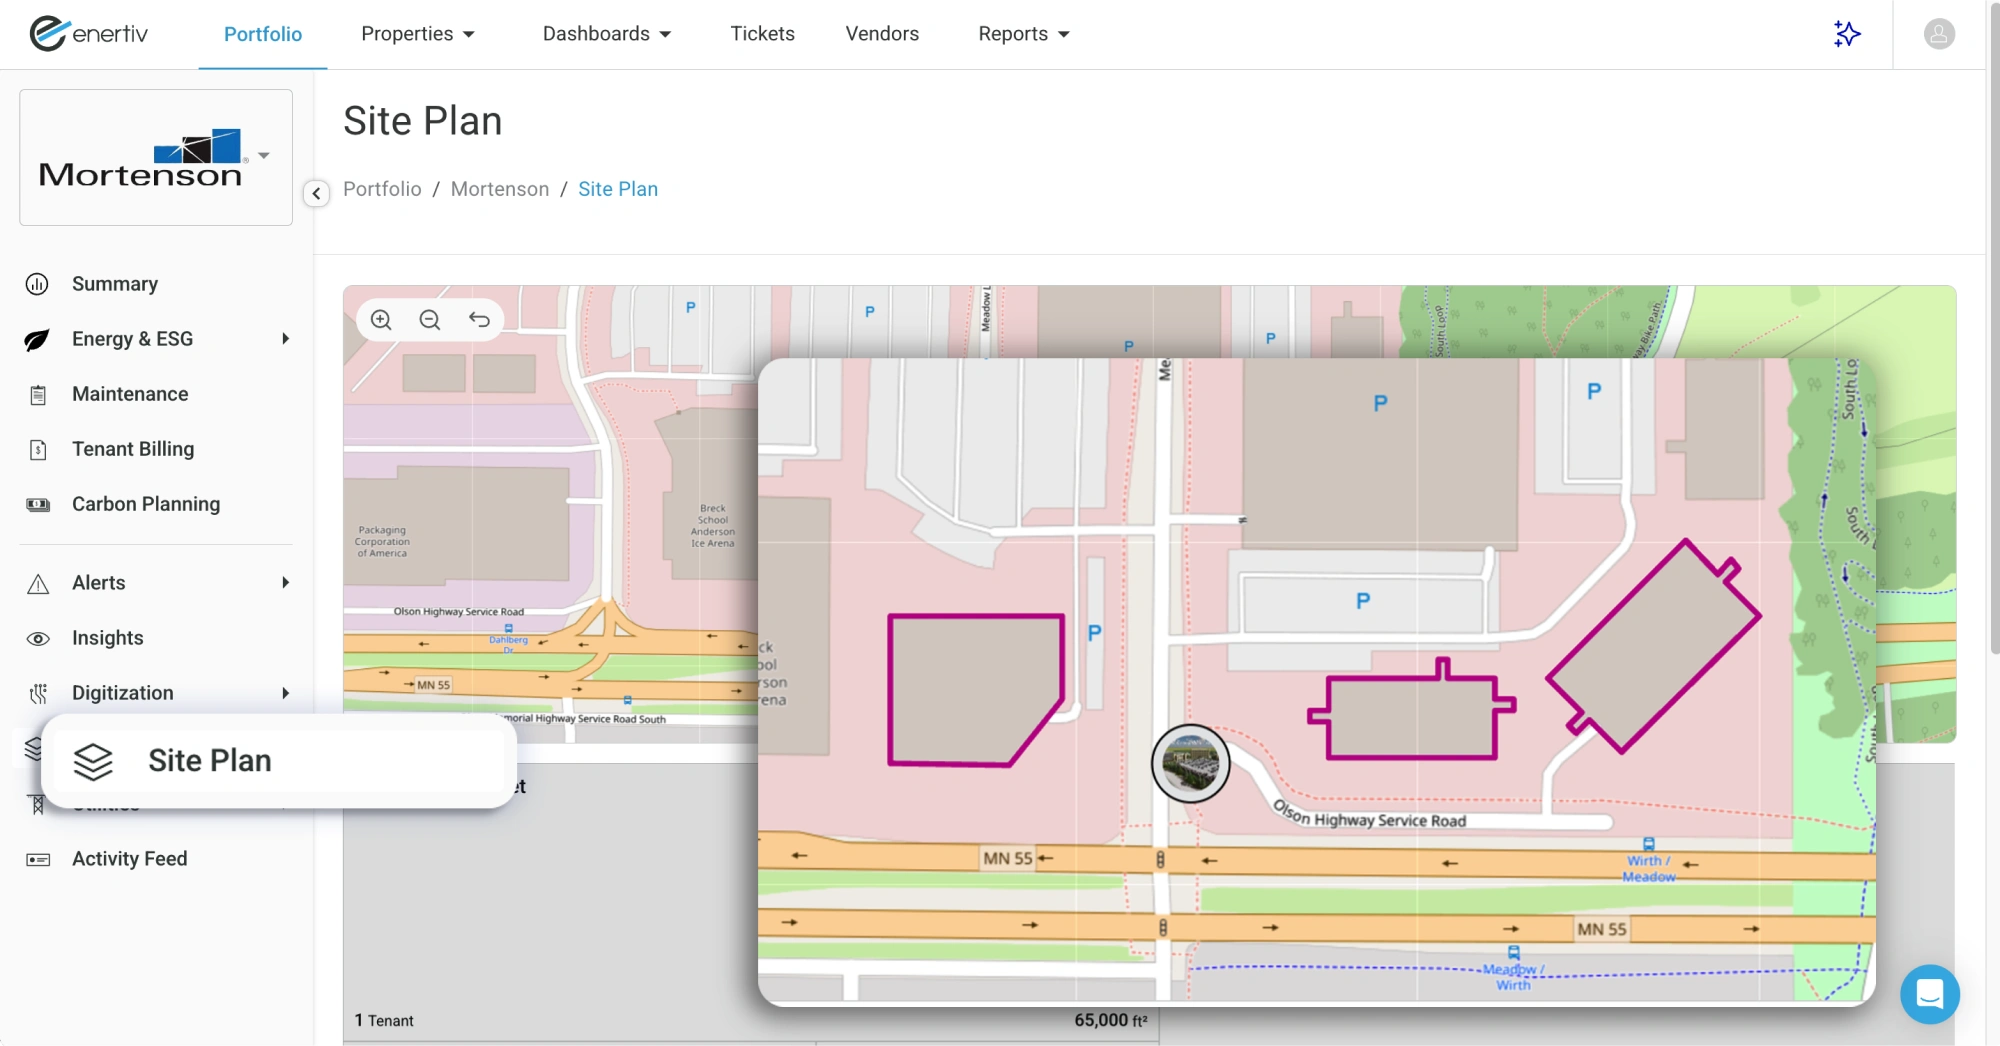
Now, getting a clear, connected view of your industrial properties is easier than ever. With the new Site Plan, you can instantly see how buildings, tenants, units, and meters fit together—so you get the full picture at a glance.
What’s New?
Interactive & Grid Views
Explore your properties in both an interactive map and a detailed grid format.
Smarter Connections
Quickly identify which tenants and meters are linked to each building and unit.
Designed for Industrial Sites
Built to better represent multi-building layouts and complex portfolios.
This update makes property management more intuitive and efficient. Check it out now!
What’s New?
We've revamped our Tenant Portal to make it easier than ever for tenants to manage their energy usage, maintenance requests, and utility bills—all in one place. With an improved interface and a more intuitive experience, tenants can quickly access the information they need to stay on top of their building-related needs.
More Transparency
Easily track energy consumption, view past bills, and stay informed about building updates.
Enhanced User Experience
Faster load times, clearer visuals, and a mobile-friendly interface ensure a smoother experience.
Simplified Navigation
A more intuitive design makes it effortless to check energy usage, submit maintenance tickets, and view utility bills.
The new Tenant Portal is designed to give tenants more control and visibility while making everyday tasks easier.
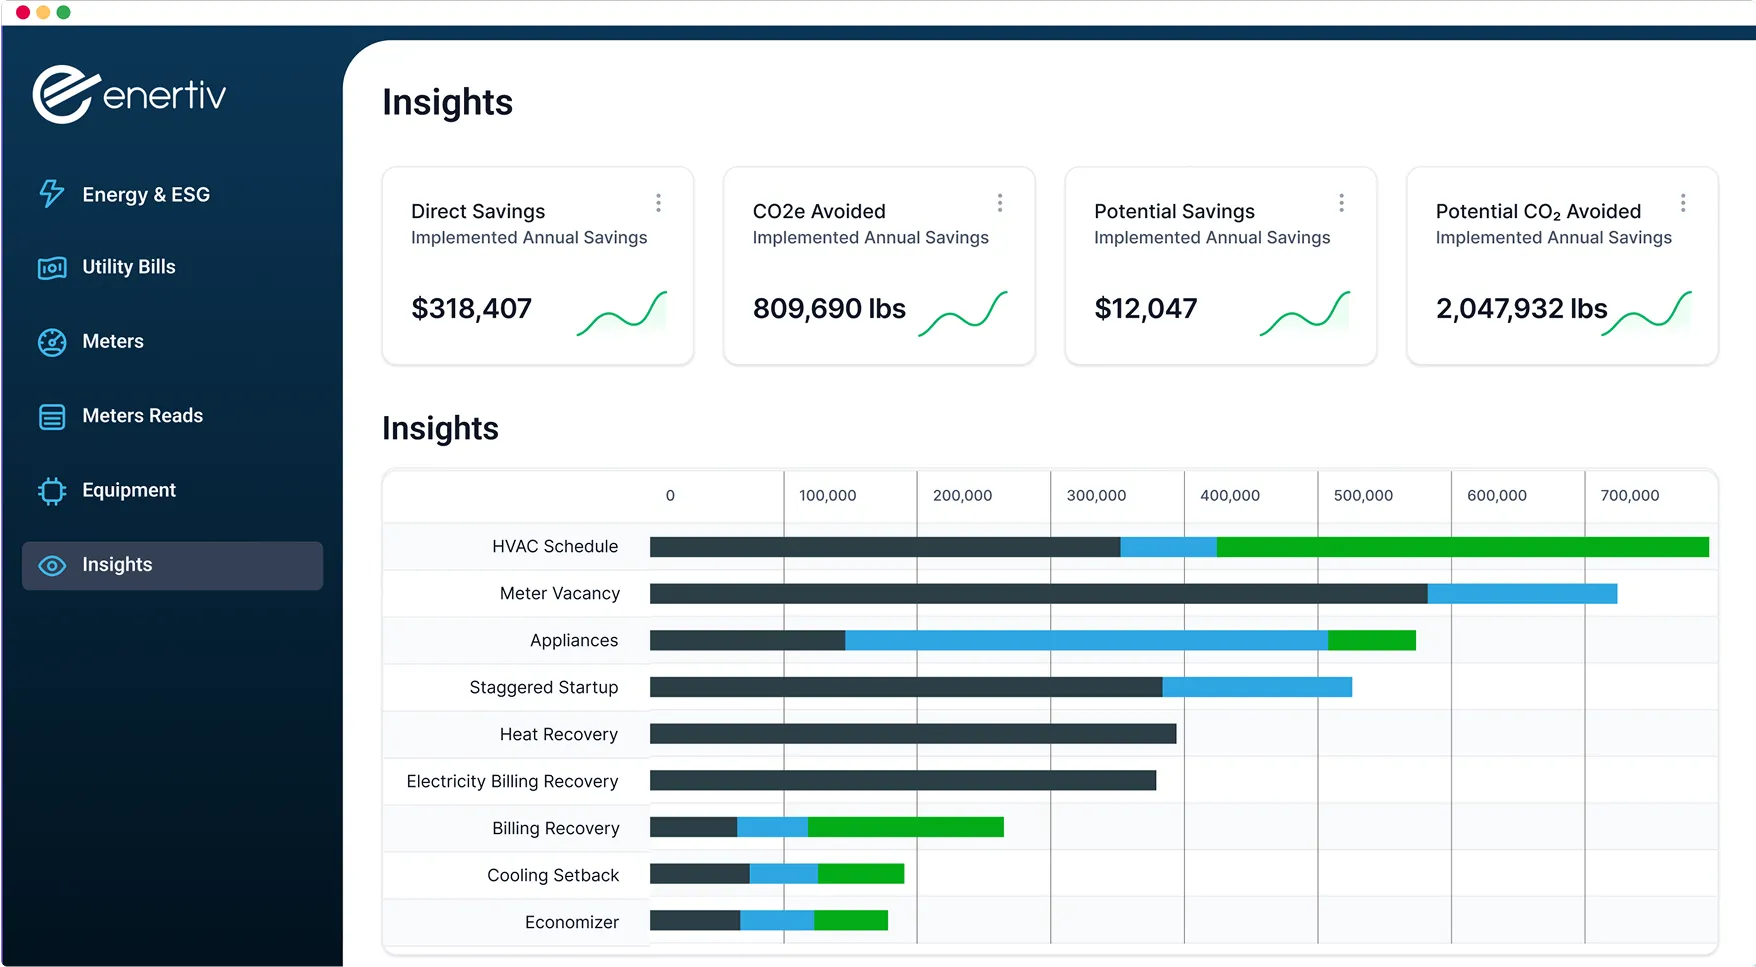
Energy Saving Insights: New Measurement & Verification (M&V) Capabilities
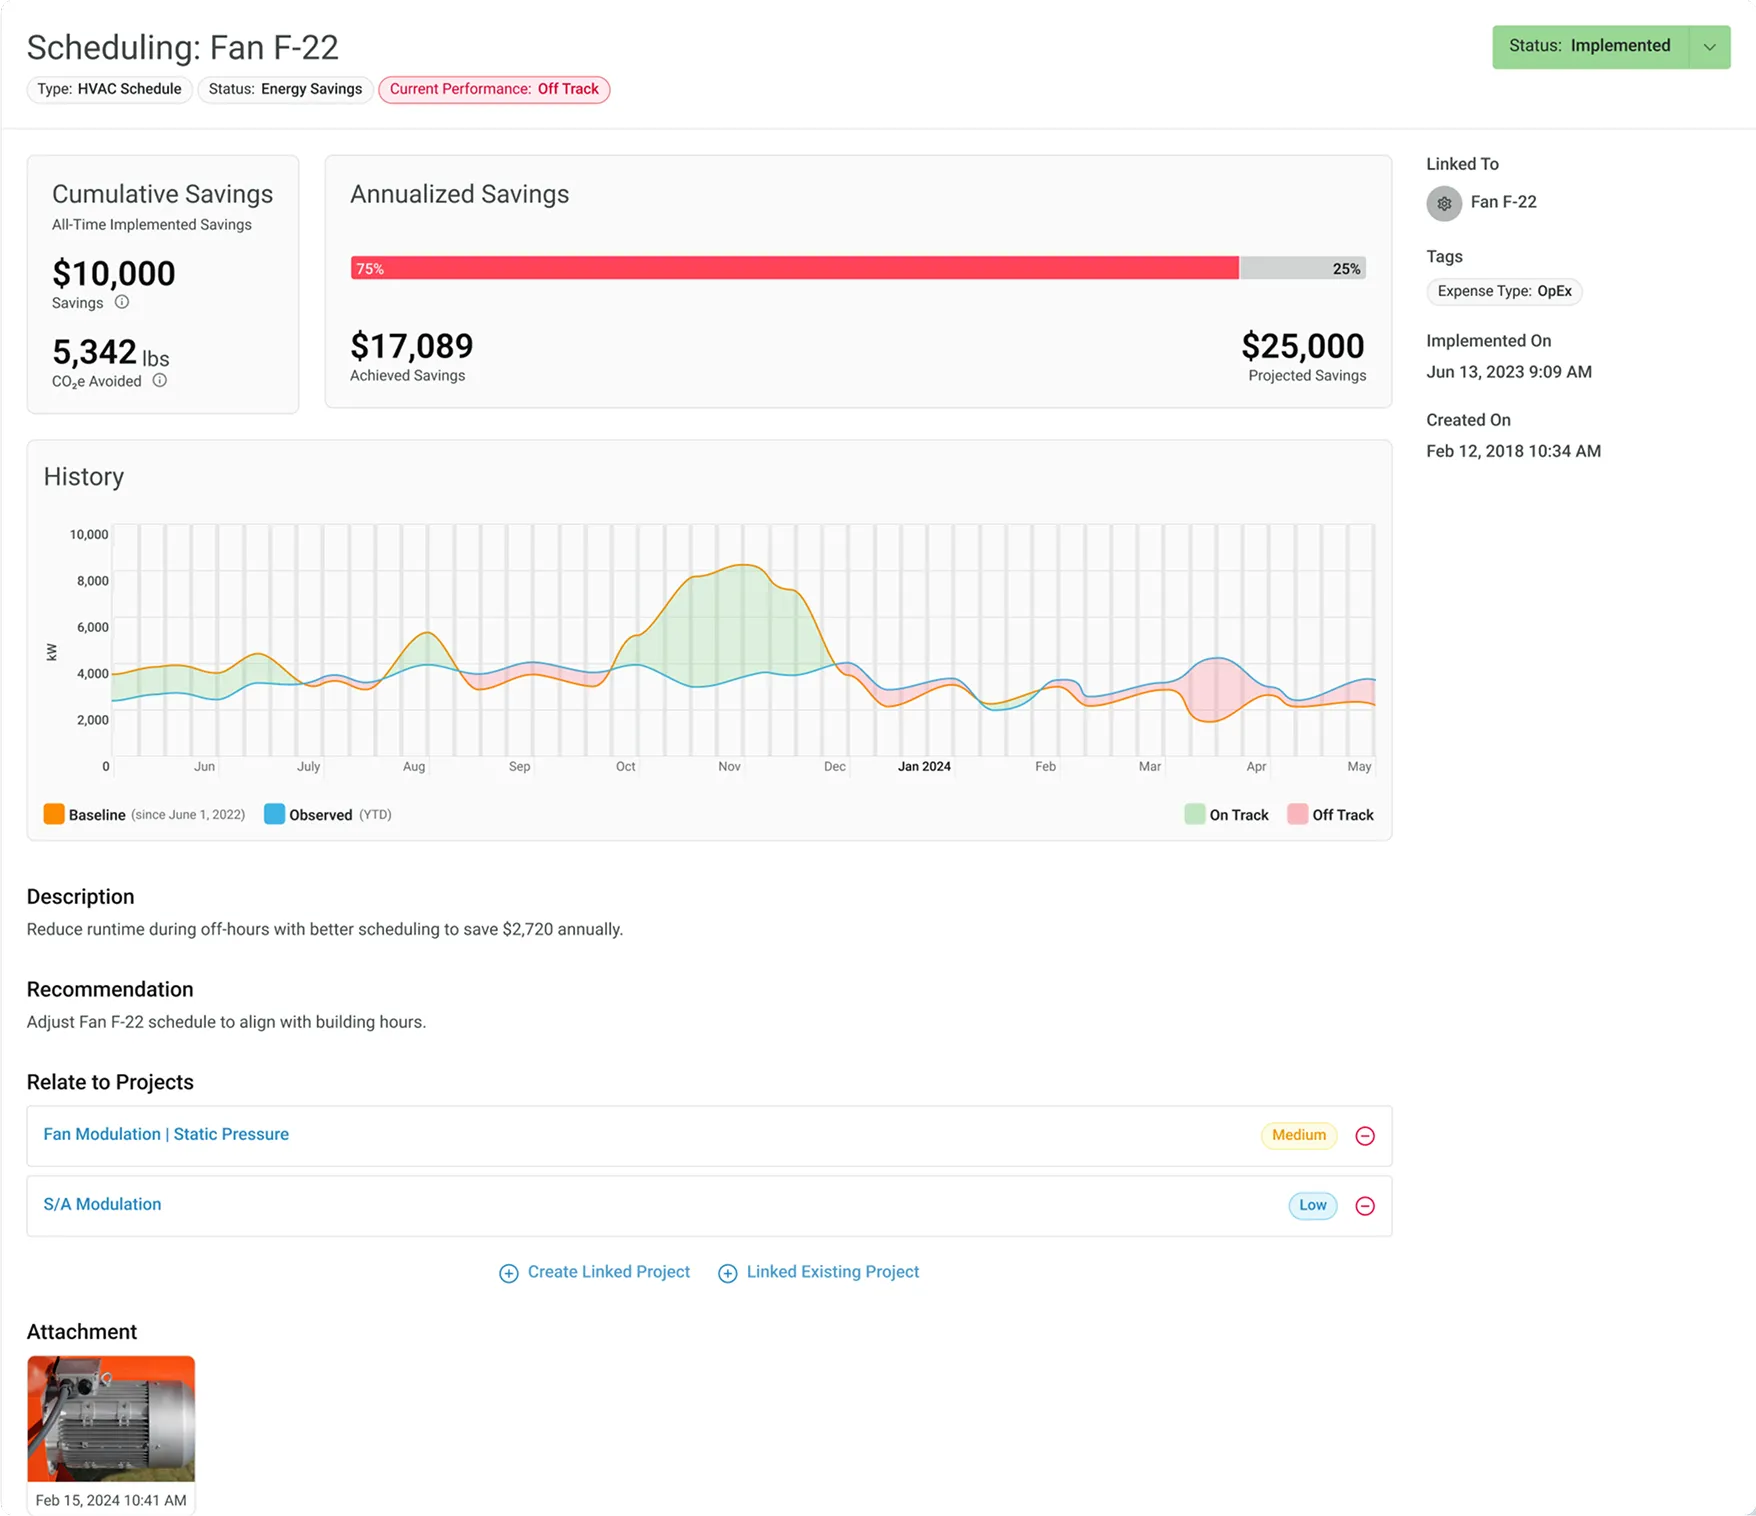
Our latest update introduces powerful enhancements to Enertiv's M&V (Measurement & Verification) capabilities. These improvements provide precise, real-time tracking and validation of energy savings, enabling your team to monitor cumulative savings, detect performance slippage, and confirm the tangible impact of energy efficiency measures across properties
Here’s a breakdown of the new capabilities and how they compare to our previous functionality.
What’s New with M&V?
Track Cumulative Savings
Before: Insights reported projected annual savings, providing an estimate without confirming actual savings over time.
Now: M&V tracks cumulative savings from the date of implementation, displaying total dollars and CO2 saved over time. This cumulative view allows you to see the full value of each insight and measure long
Monitor On-Track vs. Off-Track Status
Before: Savings were presented as an annual estimate, without real-time tracking of progress or deviations.
Now: Each insight has a two-week status check, showing whether it’s on track or off track. This proactive alert helps property managers identify and address any deviations quickly to keep energy savings on target.
Verify Partial Savings
Before: Partial implementations weren’t measurable, so savings didn’t reflect the true impact of partial or mid-year implementations.
Now: M&V calculates savings even if an insight is only partially implemented, giving an accurate reflection of savings even when conditions change. This feature ensures you capture all value from energy measures, even in dynamic scenarios.
Automatically Detect Implementations
Before: Implementation status was updated manually, requiring input from property teams.
Now: M&V automatically detects when an insight has been implemented based on real-time data, saving time and ensuring accuracy without manual updates.
Detect Slippage in Performance
Before: Insight performance was not continuously monitored, making it challenging to identify drops in efficiency.
Now: M&V automatically detects when an insight has been implemented based on real-time data, saving time and ensuring accuracy without manual updates.
Standard Insights
Annualized Savings
Provides a single annual savings estimate
Lacks Actual Progress Tracking
Unable to measure or verify actual savings progress over time
No Current Status Indicator
Unable to determine if an insight is currently achieving projected savings
Manual Status Updates
Property managers manually update implementation status
No Real-Time Monitoring
Lacks the ability to detect if an insight is consistently effective over time
No Partial Savings Accounting
Does not account for partial implementation or partial year savings
Insights with M&V
Cumulative Savings
Tracks and displays total cumulative savings since insight implementation, enabling year-over-year impact visibility
Tracks Actual Progress
Monitors real savings achieved, comparing expected vs. actual savings to validate insight impact in real time
On Track / Off Track Status
Provides a status update every two weeks, showing whether an insight is on track or off track, alerting property managers if adjustments are needed
Automatic Implementation Detection
Automatically detects when an insight is implemented based on real-time data, eliminating manual updates
Slippage Detection
Identifies and alerts when an insight's performance drops below expected levels, helping prevent inefficiencies from reoccurring
Accounts for Partial Implementations
Measures savings even if an insight is only partially implemented, providing accurate reporting on real, partial savings
Benefits of M&V for Property Teams
With M&V, Enertiv transforms insights from annual projections into a powerful, real-time tool for tracking progress, adjusting strategies, and demonstrating energy savings over time. Property managers can now confidently validate energy efficiency results, identifying which measures are working as expected and when adjustments are needed.
Enertiv now integrates with Yardi and MRI!
FEATURED INTEGRATION
Yardi
Property Management Software
FEATURED INTEGRATION
MRI Software
Property Management Software
These integrations allow Enertiv to pull in and push out critical information, keeping all your tenant and billing data in sync and making utility billing management easier for property managers. As two of the most widely used property management systems, Yardi and MRI now serve as a single source of truth—update info on either, and it automatically syncs with Enertiv.
As two of the most widely used property management systems, Yardi and MRI now serve as a single source of truth—update info on either, and it automatically syncs with Enertiv. Here are the benefits:
Automated Data Sync
Key details—tenant info, lease IDs, unit sizes, and stacking plans—are now synced automatically with Enertiv, eliminating double entry.
Automated Billing Sync
Approve bills in Enertiv, and they’re instantly sent to Yardi or MRI. No need for manual uploads or CSV files.
Seamless Tenant Transitions
Move-ins and move-outs are updated automatically, keeping property teams effortlessly in sync.
New Feature: Tenant Insights and Alerts
Your tenants now have access to the same powerful insights that you do—directly in the Tenant Portal. These tailored insights offer actionable recommendations to optimize equipment usage, reduce costs, and minimize emissions. Potential savings are calculated and displayed in both dollars and CO₂ avoided.
Reduce Runtime
Minimize energy waste during low-occupancy times.
Adjust peak time usage
Implement peak shaving strategies to cut costs during high-demand periods.
Optimize schedules
Make sure equipment runs only when needed.
Tenant Portal Update: Energy and ESG Dashboard
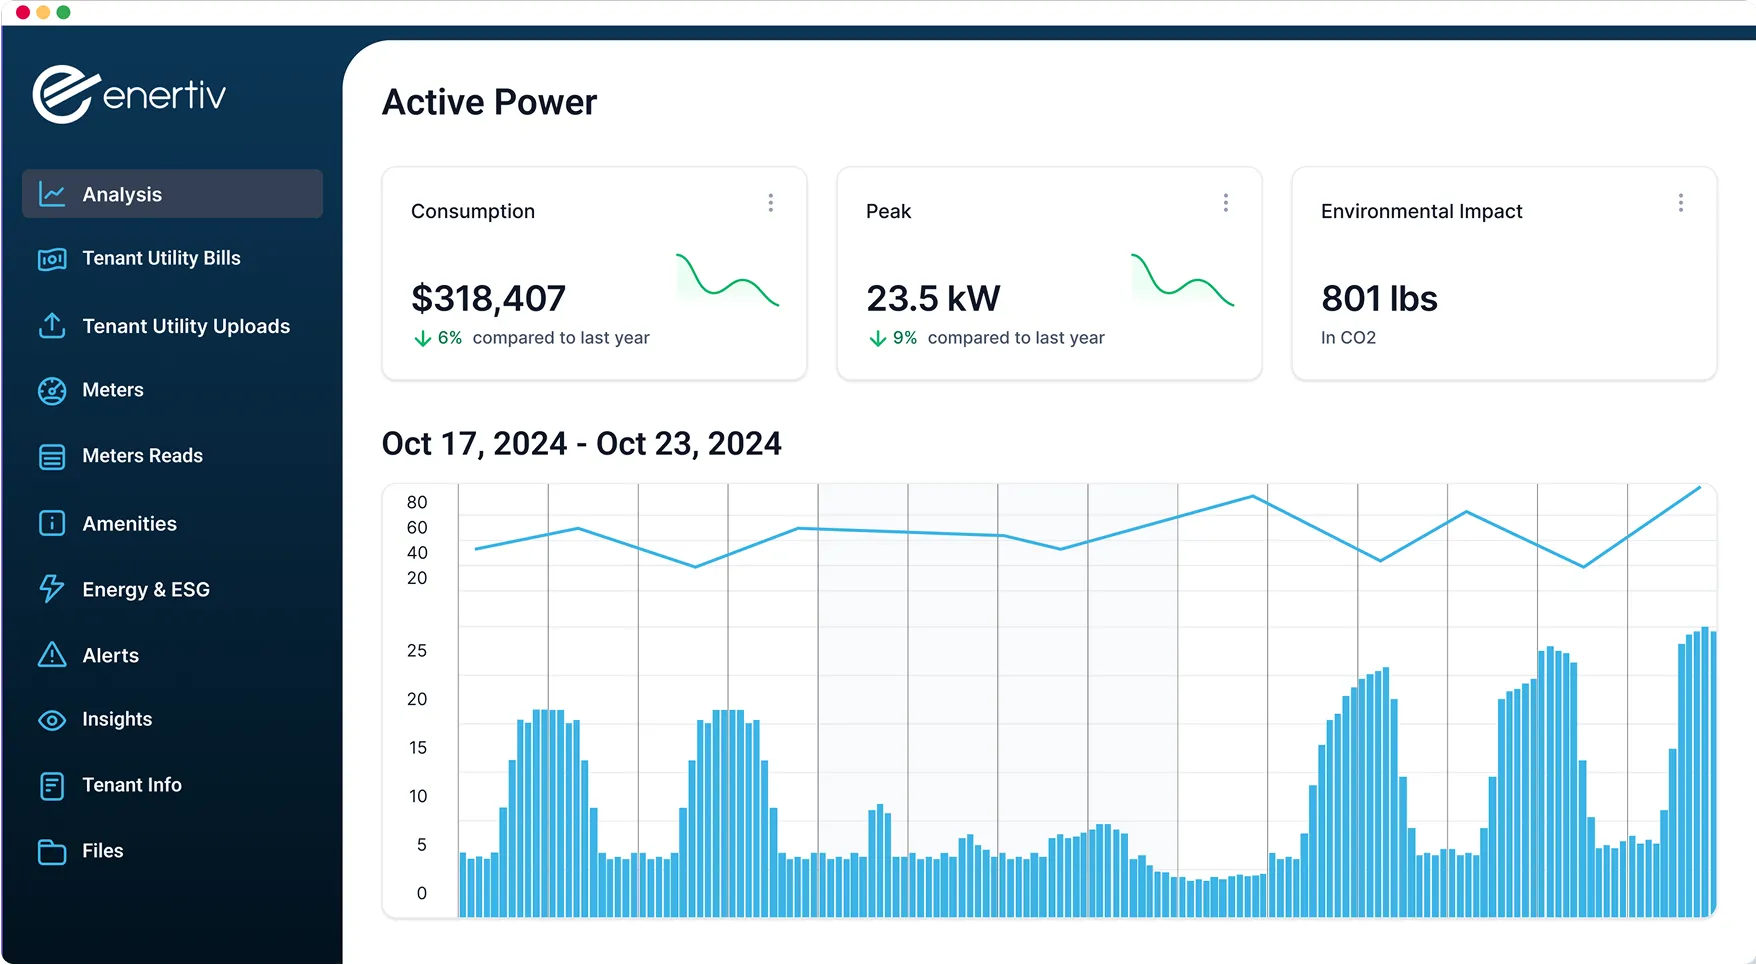
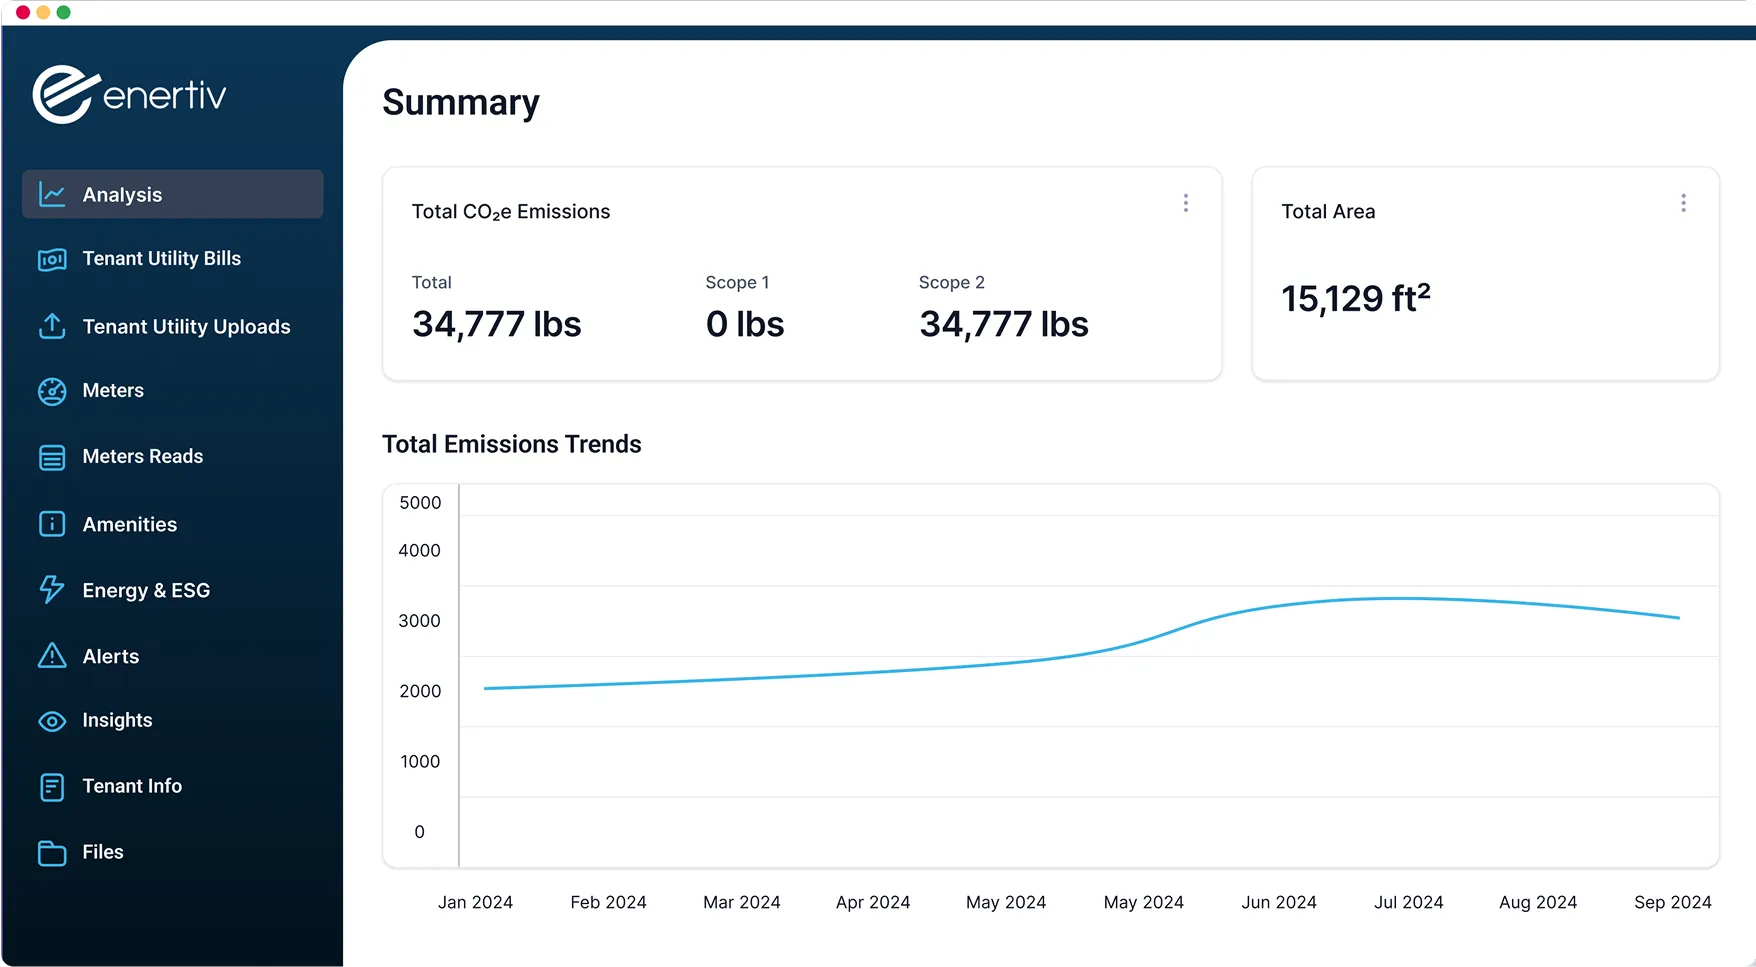
Tenants now have direct access to their own Energy & ESG Dashboard in the Tenant Portal. This update gives tenants the tools to track energy use and emissions, supporting their own ESG goals.
Features
Emissions Breakdown
View total emissions by Scope 1 and 2, with trends over time for one or multiple units.
Detailed Energy Usage Breakdown
Energy use is organized by type, with separate tabs for Electricity and Gas consumption. This breakdown helps tenants easily identify where energy is being used most.
Building ESG Accolades
In the Accolades tab, tenants can view the building’s ESG achievements—an ideal way for owners and operators to showcase sustainability efforts.
New Energy and ESG feature: Policy Tracking
Our latest feature, Policy Tracking, gives Enertiv users a clear view of the regulations that impact their properties. Using data from IMT (Institute for Market Transformation), this feature tracks policies such as benchmarking requirements, building performance standards (BEPS), and auto-retuning. It’s a proactive way to help real estate professionals understand and manage compliance needs for their properties.
Key Features of Policy Tracking
Detailed Policy Insights
See applicable policies for each property, including which building types are affected (e.g., multifamily, commercial, government).
Property-Specific Compliance
Select individual properties to see detailed information about the compliance requirements and fines associated with local laws like BEPS and benchmarking policies.
Direct Access to Source Information
For those who want deeper context, each policy includes links to source documentation, making it easier to verify details and stay informed.
New Feature: GRESB-Ready Exports
With one click, export a GRESB-compatible CSV with your utility data prefilled for GHG, energy, water, and waste. All calculations are accuracy-checked, and the report is delivered directly to you—simplifying your reporting and saving you time.
Two Ways to Sync Utility Data
Automatic Syncing
Connect Enertiv directly to the utility provider’s account (e.g., ComEd, water or gas companies) to automatically pull in bills each month—no manual effort required once it’s set up. This “one-and-done” method is the preferred approach, offering seamless integration for ongoing billing and ESG tracking.
Manual Account Setup
For cases where automatic syncing isn’t an option (e.g., privacy concerns, lost credentials, or tenant-managed accounts), users can now manually add utility accounts. Tenants or building owners can upload bills monthly. Enertiv will track the utility provider and process each bill to capture the utility data.
New Maintenance Feature: Amenity Reservations
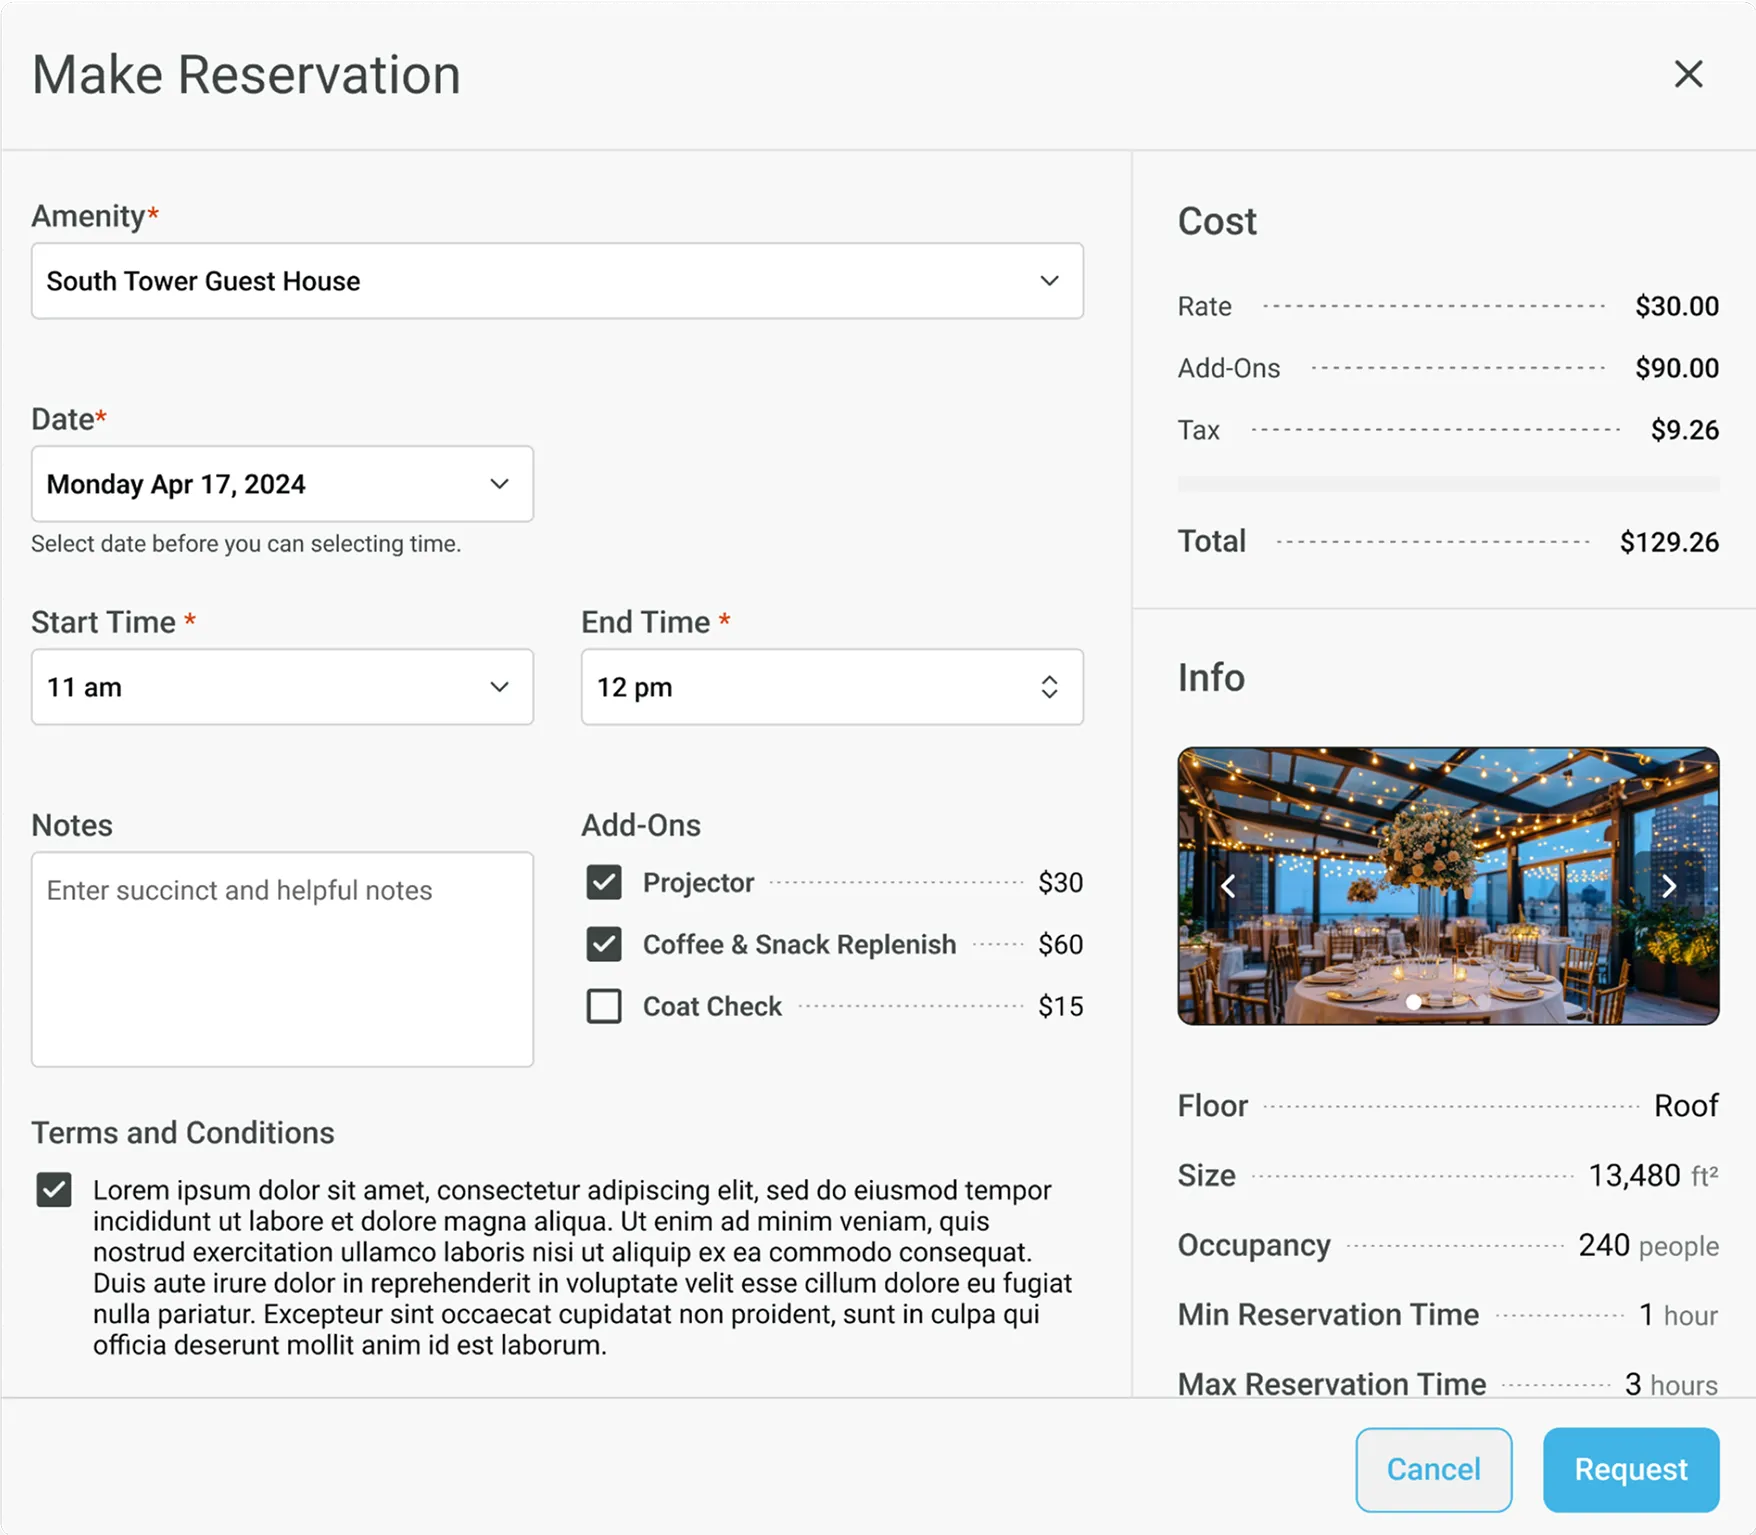
Our Amenity Reservation feature makes it easy for tenants to book building spaces like common areas, gyms, and outdoor facilities, while giving property managers full control over scheduling, approvals, and vendor coordination.
Key Features
Tenant Self-Booking
Tenants can easily book amenities—like conference rooms or outdoor spaces—directly in their portal, complete with availability, rates, and add-on options.
Customizable Options
Property teams can define amenities with images, capacity limits, hourly or flat rates, and optional add-ons (e.g., AV equipment or coffee service).
Approval & Notifications
Enable approval workflows if needed, and keep vendors in the loop with automated notifications for events requiring coordination.
Flexible Reservation Rules
Set minimum and maximum reservation times, advanced booking limits, and buffer times for smoother transitions between bookings.