Optimization Takes Seven Months. Capex Takes Four Years to Pay Back.
Every capital request comes with a payback period. Optimizations rarely get one. Using six years of data from 93 office buildings, here is how long each one takes to start saving, and to pay for itself.

Every capital request that reaches an asset manager carries a payback period. Usually it's a simple calculation: dividing the cost of the new chiller by the annual saving to get a number in years.
For some reason, optimizations get treated differently. That's likely because, while nearly every building has optimization opportunities, it's impossible to calculate specifically for a building before the data is collected. But there's enough historical data in Enertiv's data to make a closer to apples-to-apples comparison to capital upgrades.
Nothing is saved in the first three and a half months
You can't fix a schedule you can't see. Before anyone spots an air handler running at 3 a.m., the building needs real-time monitoring on the building management system (BMS) or via equipment-level monitoring. In our deployments that takes about 90 days to install. Then it needs about two weeks of data to set a baseline, so every change has something to be measured against.
That's roughly three and a half months before the first finding. It happens once per building, and every finding after that runs on its own, shorter clock.
Then the median fix takes another three and a half months
We studied 1,595 optimization findings raised from 2020 to 2026 in a sample of 93 office buildings with live Enertiv monitoring. Each one is a no-cost (besides potentially the cost of a BMS controls vendor) change with nothing to buy. HVAC schedules made up 79% of them, and 94% of the buildings had at least one.
For the timing, we looked at the fixes that were made. The median came 108 days after the finding. 56% of those were done within four months and 82% within a year. This is the clock for fixes that get made. Some were declined after an engineer's review.

Very little of that time is technical. On client calls this month, the reasons were familiar. The engineer who knew the BMS had left. A setback that saves money can also bring a tenant complaint, so it gets tested slowly, and older pneumatic or proprietary controls can turn a simple change into a contractor visit. Our engineers shorten it by turning each finding into an instruction (which point, what value, how to check it held), often with the building engineer on the same call.
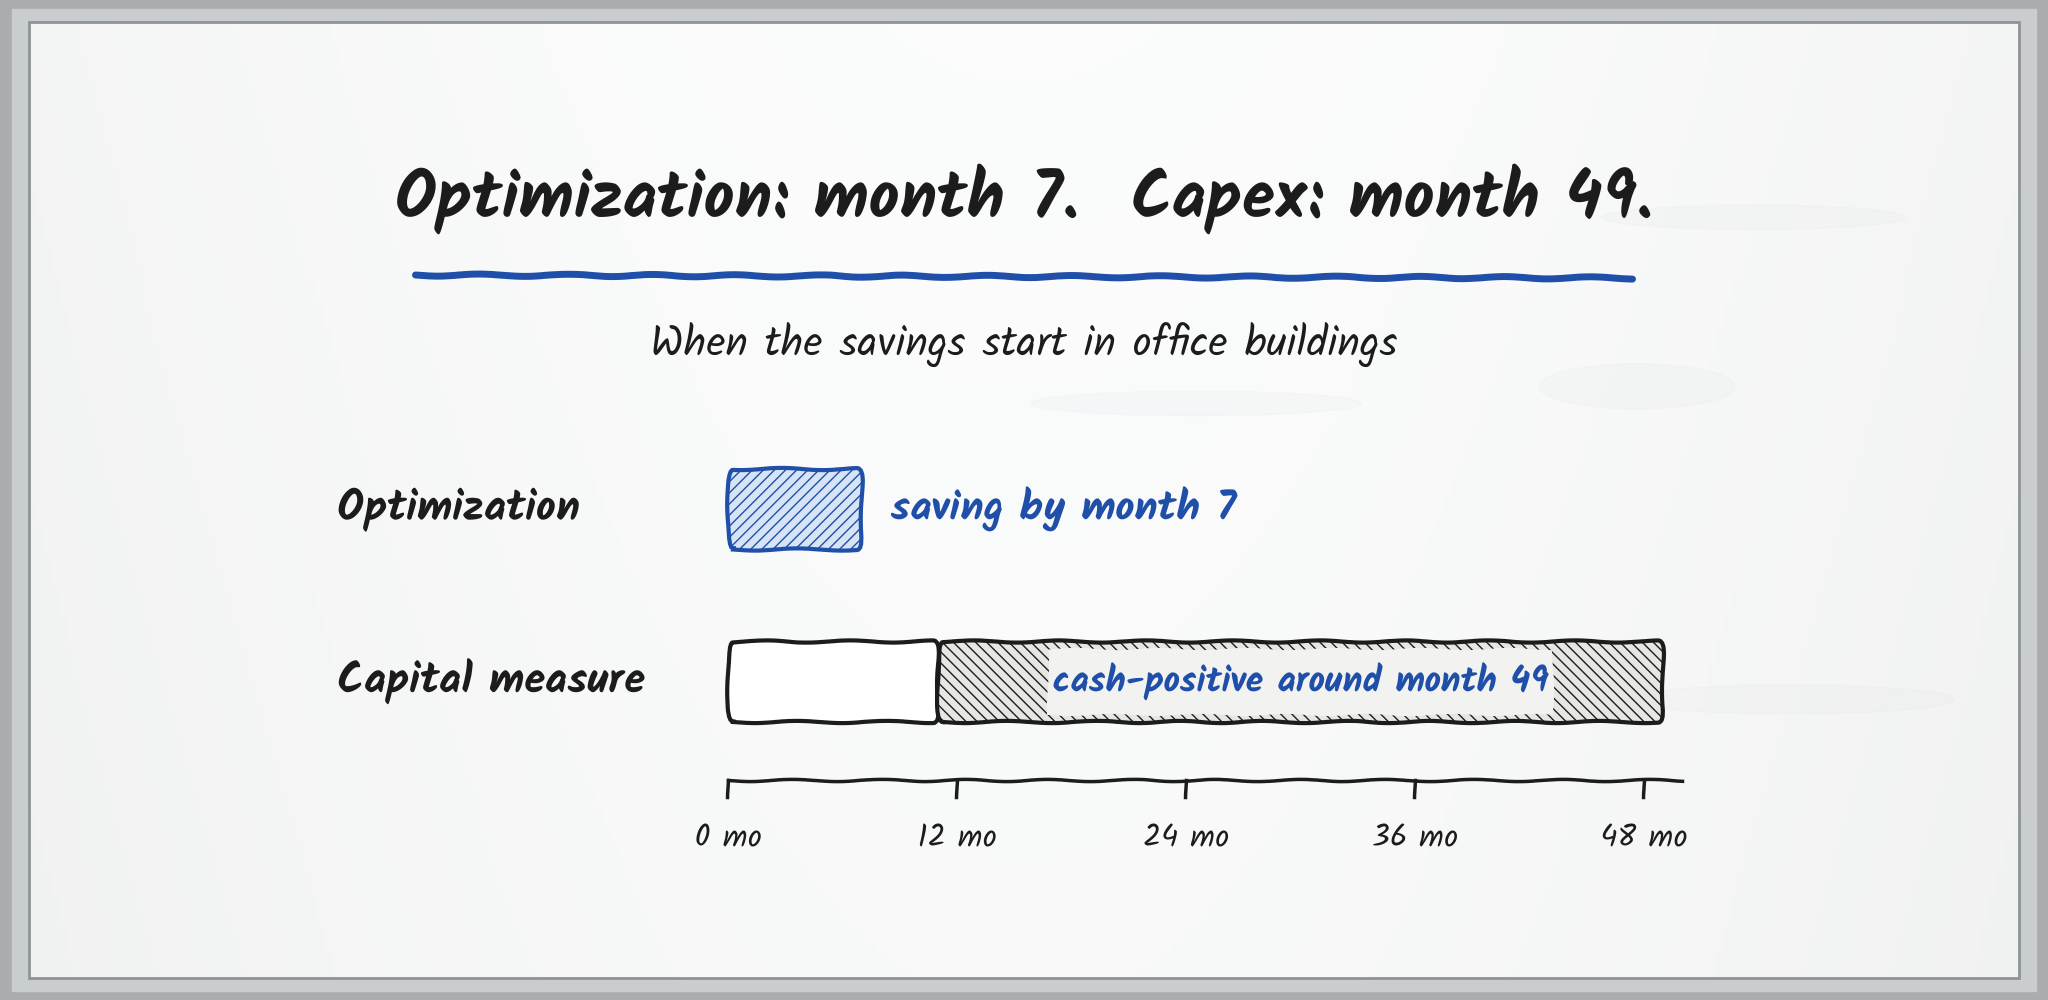
Add it up. Three and a half months to get monitoring live and baselined, then about three and a half months for the typical fix. In an office building, the typical optimization is saving money around month seven.
At month seven, the capital measure isn't in yet
We tracked capital measures to installation in the same sample of buildings. Examples included VFDs, LEDs, chiller upgrades, heat pumps, and more. They took a median 11 months from first recommendation to recorded installation.
Their savings start there, around month 11. But the measure still has to earn back its price. In LBNL's study of about 3,250 ESCO projects completed through 2008, private-sector projects had a median simple payback of 3.2 years (Larsen, Goldman and Satchwell, Energy Policy, 2012). This largely maps to Enertiv's data, which shows a median 3.5 year payback. Put the two together and a capital measure is roughly four years from recommendation to cash-positive.
That's a rough combination of two medians, but the gap is wide enough that the precision doesn't matter. Likewise, there is survivorship bias here; this is as much a reflection of acceptable investment hurdles as anything else.
The optimization side has a cost too: the monitoring. The fix itself usually costs staff time, occasionally a contractor visit, so its payback is the monitoring fee against what the fixes save, with no equipment price to recover.
One office building in our sample shows how slow a good capital project can be. Our engineers scoped an LED upgrade there in late 2023: about $180,000, with an estimated 2.3-year payback. It was recorded as installed more than two and a half years later.

The chart is generous to capital. Its clock starts once a recommendation exists, while the optimization clock starts at kickoff, before there is any monitoring at all.
What optimization is worth
Start with the strongest single result. In one office building in our sample, putting the air handlers and heaters on a schedule is measuring at well over $100,000 a year on metered results, against about $71,000 estimated for the two together. Treat the top of that number with care: the heater savings are measured against a baseline built from two weeks of data just before the change and carried forward almost five years, through later changes in the building, including the VFDs below. Even a fraction of it is a large number for a schedule change.
Most buildings are far below that. Across the 61 office buildings in our sample with at least one completed fix, the median building's fixes were worth an estimated $29,000 a year, and the top quarter $65,000 or more. Five buildings are above $100,000 estimated, and two are above it on measured results. Counting only fixes with M&V, the median building is measuring about $18,000 a year.

Savings go to NOI, and NOI sets value. Where office tenants reimburse operating expenses above a base year, part of the saving lowers those reimbursements instead of reaching NOI. Office cap rates in many markets run above 8% today, which lowers the values in the chart.
Then there's the monitoring. The median building's estimated savings would cover a monitoring fee of up to about $29,000 a year, or about $18,000 on measured results. Counted from kickoff, like the capital clock above, at typical pricing for a mid-size office building, monitoring pays for itself around month 17 on estimated savings and around month 32 on measured ones; larger towers cost more and take longer. The capital measure is cash-positive around month 49.
Estimates aren't results, so we check them. More than half of the completed office fixes in this study have M&V records, which compare metered use with a modeled baseline. The results vary widely: the median measured fix delivered about half its estimate, while about a quarter beat it. That record also shows which equipment is still wasting energy once the controls are right. In the building above, the controls came first, and the data then pointed to VFDs on its condenser water pumps and outdoor air fans, which have since been installed. That's where a VFD or a replacement actually pays back.
In a different building, one office client recently moved its condenser water pumps from running around the clock to a schedule. Pump energy fell 43% against the same period last year on raw trend data, before weather adjustment. M&V is starting, and our engineers are now building the payback case for VFDs on those same pumps. We made the broader argument in Your Decarbonization Plan Is Only as Good as the Data Underneath It and Sustainability isn't getting funded anymore unless it pays for itself.
Bottom line
If your office buildings already have monitoring, pull the open no-capex findings before the 2027 capital plan goes to committee. The ones your engineers confirm are likely the quickest returns on the list, and the metered results from fixes already done will tell you which capital requests deserve the money.
If they don't have monitoring, a kickoff this quarter puts the typical fix in place by mid-2027, while a capital measure approved in the same budget is still being installed. For examples, see our case studies.
Want to see the open no-capex findings in your office buildings, and what they're worth? Grab a time for a Free Portfolio Diagnostic.